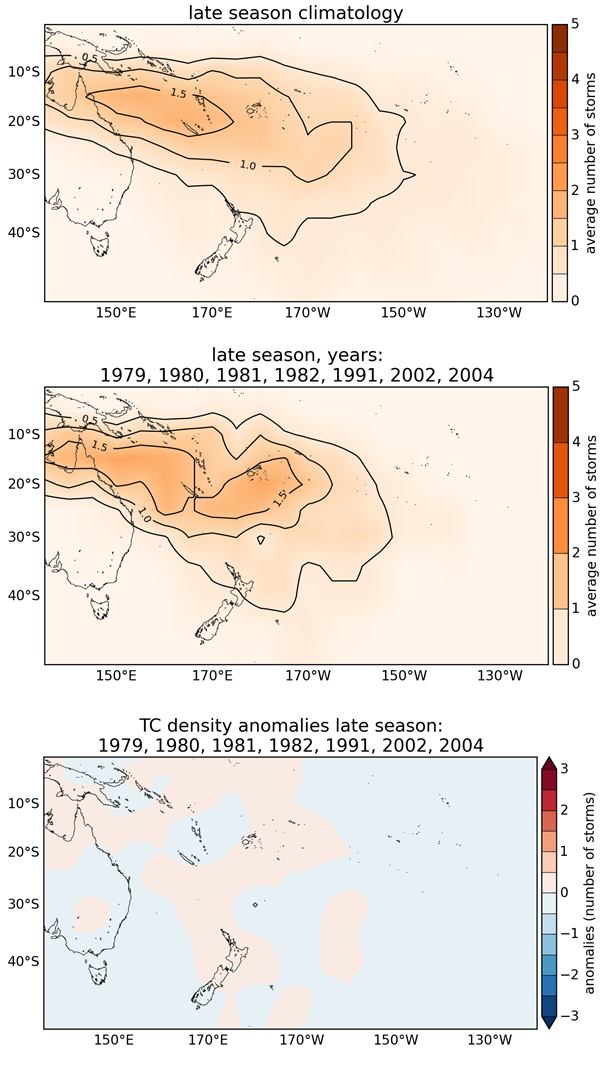
Figure 1: Number of TCs occurring for the late season (February – April) in the Southwest Pacific (135°E to 120°W): (top map) average number over 44 seasons, 1969/70 to 2012/13; (centre map) average number over selected 6 analog seasons (Table 2); (bottom map) departure from normal for the seasons (difference between count in centre and top panels).

