Riparian trees strongly modify stream habitat – most notably by shading. Riparian shading keeps stream water cool and inhibits the growth of nuisance aquatic algae and plants (Figure 1). Most of New Zealand’s approximately 400,000 km of stream length was originally heavily shaded by native riparian forest but clearing trees for agriculture and other uses has exposed many streams to direct solar heating. High peak temperatures can make streams uninhabitable for fish and invertebrates while higher average light and temperature promotes algae and plant growth. Global warming is expected to exacerbate the issues in unshaded streams.
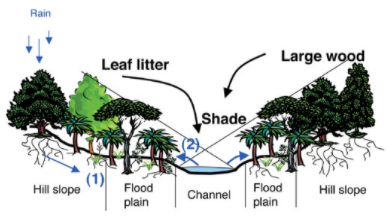
FIGURE 1. Schematic of riparian influences on stream habitat.
Planting of riparian trees to increase stream shade and reduce water temperatures, particularly rapidly lethal peak temperatures, is one of the few potential mitigations of the adverse effects of global warming on streams. Methods are needed to predict increased stream shade in the future. Numerous methods exist for measuring shade under plant canopies, and the best or ‘reference’ methods use fish-eye imaging (or analyse fish-eye photographs such as that in Figure 2A). Almost all current shade measurement methods, including analysis of fisheye images, characterise one or a few points in the stream – which is useful for correlating with (local) growth of aquatic plants but insufficient for predicting stream temperature response. A NIWA project on modelling stream shade led by Dr Fleur Matheson is investigating the characterisation of entire stream reaches for applications like predicting water temperature response.
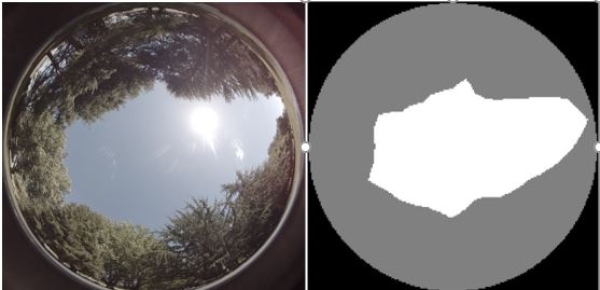
FIGURE 2. A gap in the tree canopy as seen from ground or stream level. A. fish-eye photograph, B. corresponding viewshed as modelled by Arc-GIS from LiDAR data.
Fleur says, “a potentially powerful approach to measuring stream shade at the reach scale is provided by LiDAR (Light Detection and Ranging). LiDAR uses a laser beam from an aircraft or drone to scan the ground, and the timed reflections sent back to the LiDAR unit fixes the position of the reflecting surfaces. This includes foliage of trees as well as the ground surface, buildings and water.”
Fairly large areas of New Zealand have been surveyed by LiDAR and the entire country is expected to be covered within a few years (https://www.linz.govt.nz/data/linz-data/elevation-data). Subsequent LiDAR surveys will indicate changes including growth of riparian trees. The tree canopy reflections, as well as ground reflections, can be analysed by spatial analysis software such as ArcGIS.
Senior GIS technician Sanjay Wadhwa says, “the radiation module in ArcGIS can use the digital surface model created from LiDAR data to construct a ‘viewshed’ of the canopy as seen from a point on the ground or the stream water surface.
“The viewshed can be further analysed by the radiation tool in ArcGIS, which calculates the proportion of diffuse skylight and direct sunlight that reaches the viewpoint” says Sanjay.
LiDAR data can be used in this way to estimate lighting (and its complement – shade) as a proportion of that at an open site at multiple points along New Zealand streams.

FIGURE 3. LiDAR- based digital surface model of the Piako River, Waikato Region – showing riparian trees as well as stream water in otherwise mainly pasture land.
To test how well the LiDAR approach works, the NIWA team compared LiDAR-generated shade at multiple experimental points and measured them in different ways. Figure 4 shows the LiDAR model lighting estimates compared to lighting measurements by a canopy analyser – an instrument for measuring plant biomass and indices of canopy architecture which also provides a measure of diffuse skylight. There is a reasonable correlation of modelled and measured lighting, but with a tendency for model under-estimation of lighting (over-estimate of shade). This bias can be attributed to the fact that the canopy analyser records light transmitted through the tree canopy that the ArcGIS radiation tool (necessarily) assumes is opaque. At two points (labelled 5 and 6 in Figure 4 and marked with open circles) ArcGIS markedly underestimated lighting owing to overhanging foliage of isolated trees.

FIGURE 4. Diffuse lighting (the complement of shade), as a % of that at a fully open site, calculated in ArcGIS from LiDAR data at 16 experimental points (X-axis), compared to diffuse lighting measured by LAI-2000 canopy analyser (Y-axis). At relatively high levels of shade, the ArcGIS tool tends to under-estimate lighting because it neglects canopy transmission.
Figure 4 suggests that shade will be more accurately predicted from LiDAR for larger channels (with comparatively large canopy gaps) than for small forested streams with frequent overhanging trees. The results from this work suggest that LiDAR data can provide a valuable means for characterising stream shade at the reach scale – eventually over the whole country. Furthermore, repeat LiDAR surveys should enable change in shade to be monitored over time due to land use change or riparian restoration efforts. The shade estimates will inform stream temperature modelling.
The project team recently modelled stream shade from LiDAR coverage of a 14 km reach of the Pūharakekenui/Styx River (Christchurch), which suffers from nuisance weed infestations that restrict flow and exacerbate flooding. The ArcGIS radiation tool provided useful estimates of shade for points along the Styx channel clear of overhanging vegetation (e.g., on transects shown in Figure 5), while a semi-empirical estimate of shade was applied to points under overhanging trees.

FIGURE 5. Shade modelling from LiDAR coverage along the Pūharakekenui/Styx River, Christchurch. Shade was measured to validate model estimates at five points along transects across the channel, including those shown. Shade could be estimated from LiDAR at relatively open points (white), but where vegetation overhangs (green-highlighted points) a semi-empirical approach was required.