Achievement objectives
Within a range of meaningful contexts students will be able to:
- make statements about implications and possible actions consistent with the results of a statistical investigation. [S4.7]
- find and authenticate data measures such as mean, median, mode, inter-quartile range, and range. [S5.3]
Mathematics in the New Zealand Curriculum
Introduction
A meteorologist, (mee-tee-or-ol-o-jist), is a scientist who studies the weather. Meteorologists tell us what the weather is expected to be like. This information is useful because it helps us to organise our activities.
Directions
Pretend that you are a meteorologist for the day. Meteorologists obtain mean daily temperatures by calculating the average of the maximum and minimum temperatures on that day. Do you think this is an accurate way of calculating mean daily temperatures?
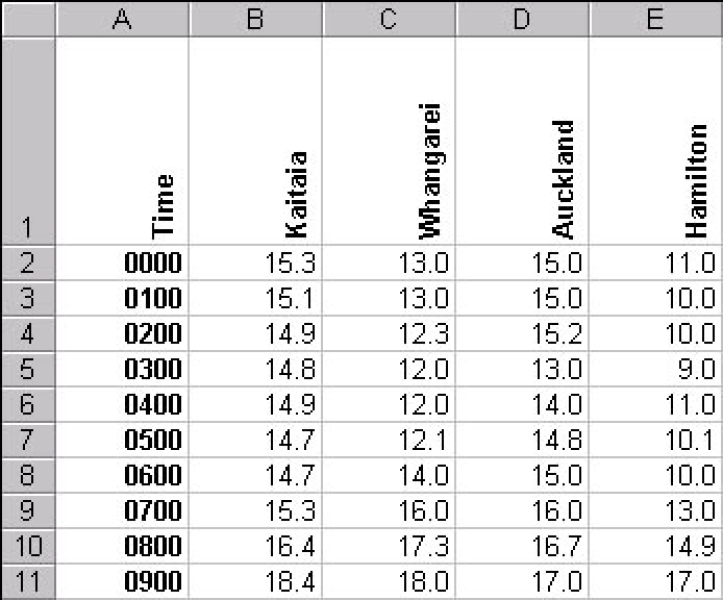
In order to answer this question you will need a set of hourly temperature data for a 24-hour period from one location around New Zealand.
Working independently
Use your set of 24-hour air temperature data to answer the following questions:
- What is the maximum temperature for the 24-hour period?
- What is the minimum temperature for the 24-hour period?
- Average the maximum and minimum temperatures to find the mean daily temperature.
- Average all 24-hourly temperatures to find the mean daily temperature.
- Calculate the difference between the two mean daily temperatures.
- How do your two mean daily temperatures compare?
Compare results in a small group
- Who has the largest difference between their two averages?
- Who has the smallest difference between their two averages?
- Is there a trend in which type of averaging obtains the highest results?
Analysis
- Which method do you think is more accurate? Why?
- Which method would you use if you were a meteorologist?
Extension
- What type of weather events would be likely to result in large differences between the two methods of averaging? Why?
- What type of weather events would be likely to result in small differences between the two methods of averaging? Why?
- Calculate the median temperature for your data and compare this with your mean values?
Dataset (hourly temperatures 1 Jan 2001)
Please choose your dataset format
- Microsoft® Excel 97/2000 spreadsheet (XLS 18 KB)
- Space delimited text file (TXT 5 KB)
- Comma delimited text file (TXT 3 KB)
- Tab delimited text file (TXT 3 KB)
Dataset (hourly temperatures 1 July 2001)
Please choose your dataset format
- Microsoft® Excel 97/2000 spreadsheet (XLS 18 KB)
- Space delimited text file (TXT 5 KB)
- Comma delimited text file (TXT 3 KB)
- Tab delimited text file (TXT 3 KB)
Resource prepared by Lesley Mackintosh RSNZ Teacher Fellow 2001, NIWA

