The NIWA and MetService assessment of named tropical cyclone (TC) activity indicates 8 to 10 named TCs could occur in the Southwest Pacific basin between November 2020 and April 2021. This seasonal outlook is for normal to below normal activity in terms of overall named cyclone systems in the region.
Tropical cyclones have a significant impact across the Southwest Pacific, with the season officially starting in November and lasting until the end of April. For the coming season, important differences are expected between the western and eastern halves of the Southwest Pacific basin and also for early and late season activity. Elevated TC presence is expected in and around the Coral Sea and north Tasman Sea, especially during the late season between February and April. Risk of a TC interaction is expected to be higher across the maritime regions around New Caledonia, Norfolk Island and to the northwest of New Zealand. Reduced TC activity is expected east of the International Dateline.
Vanuatu and New Caledonia typically experience the greatest TC activity, with an average of about two or three named cyclones passing close to those islands each year. For this season, elevated activity is expected for New Caledonia. Near normal activity is expected for Tokelau, Fiji, Vanuatu, the Solomon Islands and Papua New Guinea. Normal or slightly reduced activity is expected for Tonga, Wallis & Futuna, and Samoa. Most other islands to the east of the International Date Line are expected to have reduced TC risk for the season. Despite the risk reduction in some places, cyclones are still expected for countries that typically experience one or more named cyclones per year. At least three severe cyclones reaching category 3 or higher might occur anywhere across the region, so all communities should remain prepared.
On average, at least one ex-tropical cyclone passes within 550km of New Zealand each year. For the coming season, the risk for an ex-tropical cyclone affecting New Zealand is considered above normal. If an ex-tropical cyclone comes close to the country, there is a near-equal probability of it tracking to either the east or west of the North Island, and landfall of a degrading ex-tropical cyclone is possible. Significant rainfall, extreme winds, hazardous marine conditions and coastal damage are all possible leading up to and during these events.
At present, sea surface temperature anomalies across the eastern equatorial Pacific Ocean are cool (negative) while the central equatorial Pacific Ocean has recently been trending toward cool conditions. Atmospheric circulation patterns over French Polynesia and northern Australia indicate ENSO (El Niño-Southern Oscillation) conditions are indicative of the emergence of La Niña. The Australia Bureau of Meteorology monitoring of the Niño3.4 region (central-western equatorial Pacific Ocean) shows sea surface temperature anomalies are below 0.8°C. Oceanic and atmospheric forecasts for ENSO indicate moderate-to-strong La Niña conditions for the TC season are very likely.
Tropical cyclones are categorised in strength from 1 to 5, with 5 being the most intense. Past seasons with conditions similar to present suggest several cyclones that develop could intensify to at least category 3 strength. For the coming season, at least 3 cyclones are anticipated to reach at least category 3 strength, with mean wind speeds of at least 118 km/h winds. Category 5 strength cyclones, where sustained winds exceed 199 km/h, have occurred in some years (known as ‘analogue’ seasons) with similar conditions like what exists ahead of the 2020/21 season. Therefore, all communities should remain alert and well-prepared for severe TC events.
New Zealand should also remain vigilant as the season unfolds. Most historic seasons used in the preparation of this outlook showed multiple ex-tropical cyclones passing within 550 km of the country. Significant wind, waves and rainfall are possible from ex-tropical cyclones. The effects of ex-tropical cyclones can be spread over a large area, particularly if the decaying ex-tropical cyclone interacts with mid-to-high latitude weather systems.
All communities, regardless of changes in TC risk, should still remain vigilant and be aware if the regional climate situation (including ENSO) changes. As with most years, TC activity is expected to increase during the second half of the season from February-April. Early season TC activity is expected to be largely reduced, except near Fiji, and a potential start to cyclone activity may also occur close to or after the New Year.
NIWA, MetService, MeteoFrance, BoM, NOAA and Pacific Island National Meteorological Services will all continue to track the progression of ENSO and TC activity, with an update to this guidance in January 2021 if needed.
It does not take a direct hit or a severe cyclone to cause significant damage or life-threatening weather. When dangerous weather is forecast, please heed the advice of your local meteorological service, civil defence, or disaster management offices.
New Zealand’s National Institute of Water & Atmospheric Research (NIWA) and Meteorological Service of New Zealand (MetService) formulated this seasonal tropical cyclone outlook, along with contributions from the University of Newcastle and meteorological forecasting organizations from the Southwest Pacific, the Australian Bureau of Meteorology, MeteoFrance and the Pacific Island National Meteorological Services.
Figure 1. Maps of tropical cyclone risk (top) and overall seasonal outlook for the number of named cyclones interacting with an island group (bottom) based on the 2020-21 Island Climate Update tropical cyclone guidance.
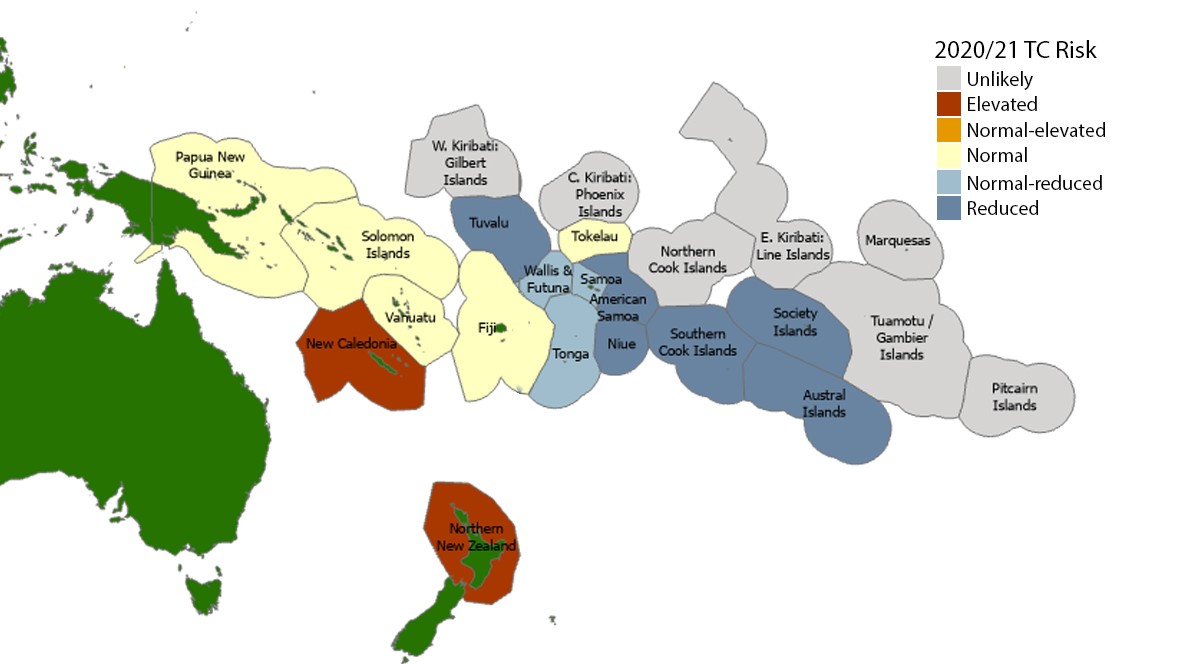
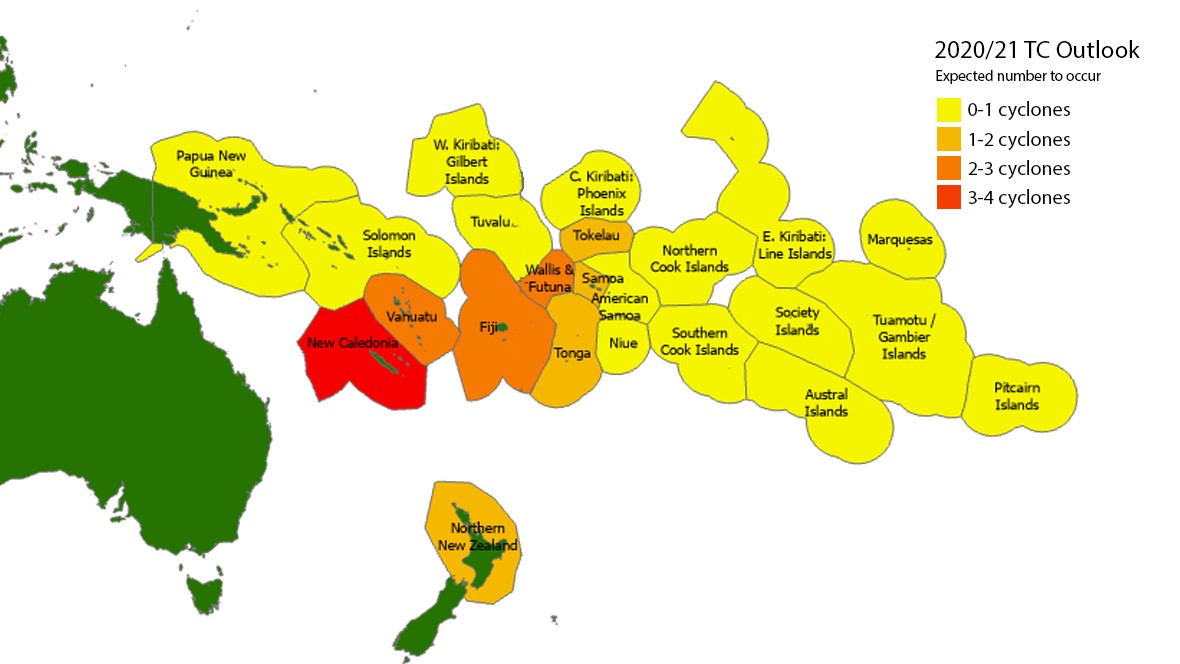
Table 1: Island Climate Update (ICU) consensus outlook for November 2020-April 2021 tropical cyclone activity based on combining NIWA analogue model, international dynamical climate model and TCO-SP deterministic statistical model outlook results. Indications for upcoming TC activity based on these joint methods that cover the SW Pacific basin for the 2020/21 season are stated in the “ICU Consensus” column and are also shown in Figure 1. Expected TC numbers are based on the NIWA Analogue method (see Table 2) and supported by the TCO-SP deterministic method.
|
TC activity |
NIWA |
International |
|
TCO-SP |
ICU |
Outlook |
|
|
2020/21 |
Analogue |
Dynamical |
|
|
Deterministic |
Consensus |
Confidence |
|
SP Basin |
Normal-reduced |
Normal |
* |
Reduced |
Normal-Reduced |
Moderate-high |
|
|
New Caledonia |
Elevated |
Elevated |
1 |
Normal |
Elevated |
Moderate-high |
|
|
N. New Zealand |
Elevated |
Normal-elevated |
Elevated |
Elevated |
Moderate-high |
||
|
Fiji |
Normal |
Normal |
Normal |
Normal |
High |
||
|
Solomon Is. |
Normal |
Normal |
Normal |
Normal |
High |
||
|
Papua New Guinea |
Normal |
Normal |
Normal |
Normal |
High |
||
|
Vanuatu |
Normal |
Normal-elevated |
Normal |
Normal |
Moderate-high |
||
|
Tokelau |
Normal-elevated |
Normal |
Reduced |
Normal |
Moderate |
||
|
Wallis & Futuna |
Normal |
Normal |
2 |
Reduced |
Normal-Reduced |
Moderate-high |
|
|
Samoa |
Normal |
Normal-reduced |
Reduced |
Normal-Reduced |
Moderate |
||
|
Tonga |
Reduced |
Normal |
Normal |
Normal-reduced |
Moderate-high |
||
|
Tuvalu |
Reduced |
Normal |
Reduced |
Reduced |
Moderate-high |
||
|
Niue |
Reduced |
Normal-reduced |
3 |
Reduced |
Reduced |
High |
|
|
American Samoa |
Reduced |
Normal-reduced |
Reduced |
Reduced |
High |
||
|
S. Cooks |
Reduced |
Normal-reduced |
4 |
Reduced |
Reduced |
High |
|
|
Austral Is. |
Reduced |
Normal-reduced |
Reduced |
Reduced |
High |
||
|
Society Is. |
Unlikely |
Normal-reduced |
Reduced |
Reduced |
Moderate-high |
||
|
N. Cooks |
Unlikely |
Normal-reduced |
5 |
Unlikely |
Unlikely |
High |
|
|
Tuamotu |
Unlikely |
Normal-reduced |
Unlikely |
Unlikely |
High |
||
|
W. Kiribati |
Unlikely |
Normal |
Unlikely |
Unlikely |
Moderate-high |
||
|
Marquesas |
Unlikely |
Normal-reduced |
Unlikely |
Unlikely |
High |
||
|
Pitcairn |
Unlikely |
Reduced |
Unlikely |
Unlikely |
High |
||
|
C. Kiribati |
Unlikely |
Normal |
Unlikely |
Unlikely |
Moderate-high |
||
|
E. Kiribati |
Unlikely |
Normal-reduced |
Unlikely |
Unlikely |
High |
||
|
*TCO-SP model area of focus |
1. Island scale model |
||||||
|
2. Northern SW Pacific region |
|||||||
|
3. Central SW Pacific region |
|||||||
|
4. Southeast SW Pacific region |
|||||||
|
5. Northeast SW Pacific region |
|||||||
Additional background information
Summary of analogue, dynamical and deterministic guidance for the ICU TC outlook
Analogue, dynamical and deterministic model guidance for the SW Pacific show relatively good agreement for the coming season (Table 1). The ICU consensus column is based on the combined outcomes for the three aforementioned types of seasonal outlook information. The consensus forms the basis for the full season (November-April) outlook for Southwest Pacific TC activity (and risk) for the 2020/21 season. It should be noted that there are only very minor differences in terms of the TC risk that are ascribed using the consensus method relative to previous years that used the analogue guidance supported by the dynamical guidance. Future work will evaluate (and validate) the outcome of each individual model vs the consensus-based approach.
Modern analogue guidance
TCs in the Southwest Pacific usually develop between November and April, but occasionally they develop in October and May, and very rarely in June – August. An analysis of past TC tracks in the SW Pacific indicate they are exceptionally unlikely in September, although one system recently formed during this time. Peak TC season in the SW Pacific Basin is usually from January to March.
Based on seasons with similar background climate conditions to the present, TC activity in the coming season is expected to be elevated around the Coral Sea between the Queensland coast and New Caledonia. In addition, TC activity is expected to be elevated across the north-central Tasman Sea region, encompassing the maritime area near Norfolk Island and to the northwest of New Zealand. Risk of TC occurrence is elevated for New Caledonia. On average, nearly half of the TCs that developed since the 1969/70 season have reached at least category 3 cyclones with mean wind speeds of at least 64 knots (118 km/h).
To find past analogues that describe the climate state leading into the upcoming TC season, the conditions for May 2020 through to the beginning of October 2020 were examined for the tropical Pacific. Similar situations from 1969 to the present were then identified from the historical record. For most of austral winter (June-August) and early spring 2020 (September), the ENSO system was neutral, but was progressing steadily toward La Niña (which we are now presently in). The available information from international forecasting centres that issue global climate outlooks and ENSO diagnostics are integrated by NIWA’s National Climate Atmosphere and Hazards Centre. The collective guidance summarised by NIWA suggests a moderate to strong La Niña is very likely (93% chance), with the likelihood of ENSO neutral conditions being low (22% chance), during mid-summer through to early autumn. Development of El Niño is highly unlikely. As such, an additional element used to hone the historic analogues for the coming TC season included years when ENSO conditions during November-April were reminiscent of moderate to strong La Niña.
To help identify past ENSO conditions for the selection of analogue seasons, we used an ENSO index that combines the Southern Oscillation Index (SOI) with the most widely-used oceanic index of sea surface temperature anomalies in the equatorial central-western Pacific (NINO3.4). This joint ENSO index is described in Gergis and Fowler (2005) as the “Coupled ENSO Index” (CEI). Using the CEI, we selected analogue TC seasons for the 2020/21 outlook, highlighting seasons when the equatorial SSTs and the SOI were indicative of a transition from neutral ENSO conditions in winter-spring to La Niña conditions during summer-autumn.
Six initial analogue TC seasons (1970/71; 1978/79; 1995/96; 2005/06; 2007/08; 2017/18) typified the antecedent ENSO development for austral winter-early spring; one of them (1978/79) did not meet our expectations for the coming season based on international ENSO forecasts. Note that the selection of analogue seasons in this step of the outlook relates to the high-quality TC data period in the satellite era beginning in 1969/70 (50 seasons, for which the availability of TC track data are current only to the end of the 2018/19 season), and the limited number of similar analogues to this season (including rejected analogues). As such, the tropical cyclone guidance for November 2020 to April 2021 is built on the five remaining analogue seasons identified above.
NIWA’s SW Pacific TC outlook spans four areas of responsibility overseen by international monitoring and forecast agencies (RMSC Nadi, the Australian TCWC, TCWC Port Moresby and TCWC Wellington). We used a high-quality set of past TC tracks from the International Best Tracks Archive for Climate Stewardship (IBTrACS) which covers 135°E to 120°W longitude to draw on past TC track patterns for the seasonal outlook. The domain for the seasonal outlook encompasses a basin that is defined by climatological properties of TC occurrences rather than geopolitical or meteorological service administrative boundaries (Diamond et al., 2012). Elevated activity is expected in the Coral Sea offshore of Queensland, between the Solomon Islands and New Caledonia, and in the north-central Tasman Sea (including Norfolk Island). The outlook for the region to the east of the International Date Line largely shows reduced risk overall, but small areas of increased TC track numbers clustered near the International Date Line close to Fiji.
Elevated risk of TC activity exists for New Caledonia, while normal activity is expected for Vanuatu, Fiji, the Solomon Islands, Papua New Guinea and Tokelau (See Table 1 and Table 4; Figure 1, 2 & 3). The main TC genesis region is expected to lie within a band between 10 – 12°S (northwest of Vanuatu) to the west of the International Date Line but shifted slightly west of normal. There is a clear signal for elevated risk of cyclones developing and tracking west of the International Date Line during the late season. All analogue seasons had at least one cyclone of category 3 or greater strength, and a majority of the analogue seasons (4 out of 5) experienced a minimum of three severe cyclones (≥ category 3). Two of the five analogue years experienced at least one category 5 tropical cyclone, which we cannot rule out for this coming season. A total of 9 named cyclones are expected this coming season (spread of 8-10 based on past analogues), which is close to or slightly below normal activity.
A split of the analogue TC seasons into early (November – January) and late (February – April) periods suggests TC activity will be diminished relative to normal for the early part of the TC season, except near the north Coral Sea (Figure 4). Several analogues identified also did not see the first named cyclone of the season until the New Year. Activity in general is expected to increase during the late season, especially for islands west of the International Date Line around the Coral Sea. The spatial anomalies shown for this TC outlook strongly indicate reduced risk of cyclones for American Samoa, French Polynesia, and the Cook Islands.
Previous TC research has indicated cyclone track sinuosity reduces during La Niña (Philip Malsale, 2011). This means that some tropical cyclone tracks for the coming season, if La Niña fully matures, may have straighter trajectories than normal. TC intensity is partly related to how long developing cyclonic systems reside in the tropics and gain support for their growth from underlying warm waters. In addition, the subtropical jet and South Pacific Convergence Zone (SPCZ) mutually interact and contribute to shear (which can disorganise cyclone systems) during extra-tropical transition. Steering winds are expected to be displaced south of normal, which may lead to reduced shear and increased retention of cyclone strength in the north Tasman Sea upon extra-tropical transition. The outcomes from this type of situation may include stronger ex-tropical cyclone impacts to northern New Zealand.
The interplay of hemispheric-scale atmospheric circulation with the timing of short-term Madden-Julian Oscillation (MJO) activity on a 30 to 50-day cycle has significant bearing on regional TC activity. Increased frequency and more intense TC activity can be expected during the MJO 6-7 paired phase (Diamond and Renwick, 2015). Weekly statistical forecasts of TC genesis and TC activity for the SW Pacific basin are produced by MeteoFrance based on phasing of the MJO (Leroy and Wheeler, 2008). This guidance is useful for sub-seasonal regional tropical cyclone guidance (see http://www.meteo.nc/espro/previcycl/cyclA.php.) Real-time MJO monitoring is also available from the Australian Bureau of Meteorology at http://www.bom.gov.au/climate/mjo/.
TC tracks for past seasons similar to our expectations covered a wide region both east and west of and including the International Date Line (~165°E – 165°W) during extra-tropical transition (ETT) exiting the tropics at 25°S latitude (Diamond et al., 2013). For the historical TC tracks in the seasons we have selected as analogues, there is a very large spread for the location where each system underwent ETT that presents significant uncertainties for maritime navigation risks. Nevertheless, the maritime region between New Caledonia and New Zealand appears to have elevated risk for TC activity this season, and extra caution for those navigating that area (especially during the late season) is warranted.
Previous work indicates New Zealand interacts with at least one ex-tropical cyclone passing within 550 km of the country every year on average (Lorrey et al., 2014). Some years there are none, while in other years there are more than one. For the coming TC season, the risk for New Zealand is elevated. We identified ten ex-tropical cyclones using five analogue seasons in this outlook that passed close to New Zealand, which gives a rounded average of 2 ex-tropical cyclones per year. The historic tropical cyclones tracks selected for this outlook that passed close to New Zealand indicate a near equal probability of decaying ex-tropical cyclones tracking offshore to either the east or west of the North Island (see Figure 3).
Dynamical climate model guidance summary
There is very good agreement across the dynamical climate models with regard to forecast rainfall, air pressure, rainfall, and sea surface temperatures (SSTs) across the Southwest Pacific.
This owes to a moderate-to-strong La Niña signal, which the models are capturing, increasing forecast confidence. The cooler than average equatorial SSTs, associated with La Niña, are forecast to be enveloped by warmer than average SSTs about much of the Southwest Pacific. Above average SSTs are also forecast for the waters surrounding New Zealand (e.g. Tasman Sea and east of the country).
There is strong agreement for above normal rainfall from New Caledonia to the Cook Islands, including most island groups in between (Figure 5 & 6). A southward displacement of the South Pacific Convergence Zone (SPCZ) is typically observed during La Niña and the model guidance is supportive of this shift. The predicted SST and rainfall distribution suggest a more active SPCZ than normal is possible from near the Solomon Islands to Fiji.
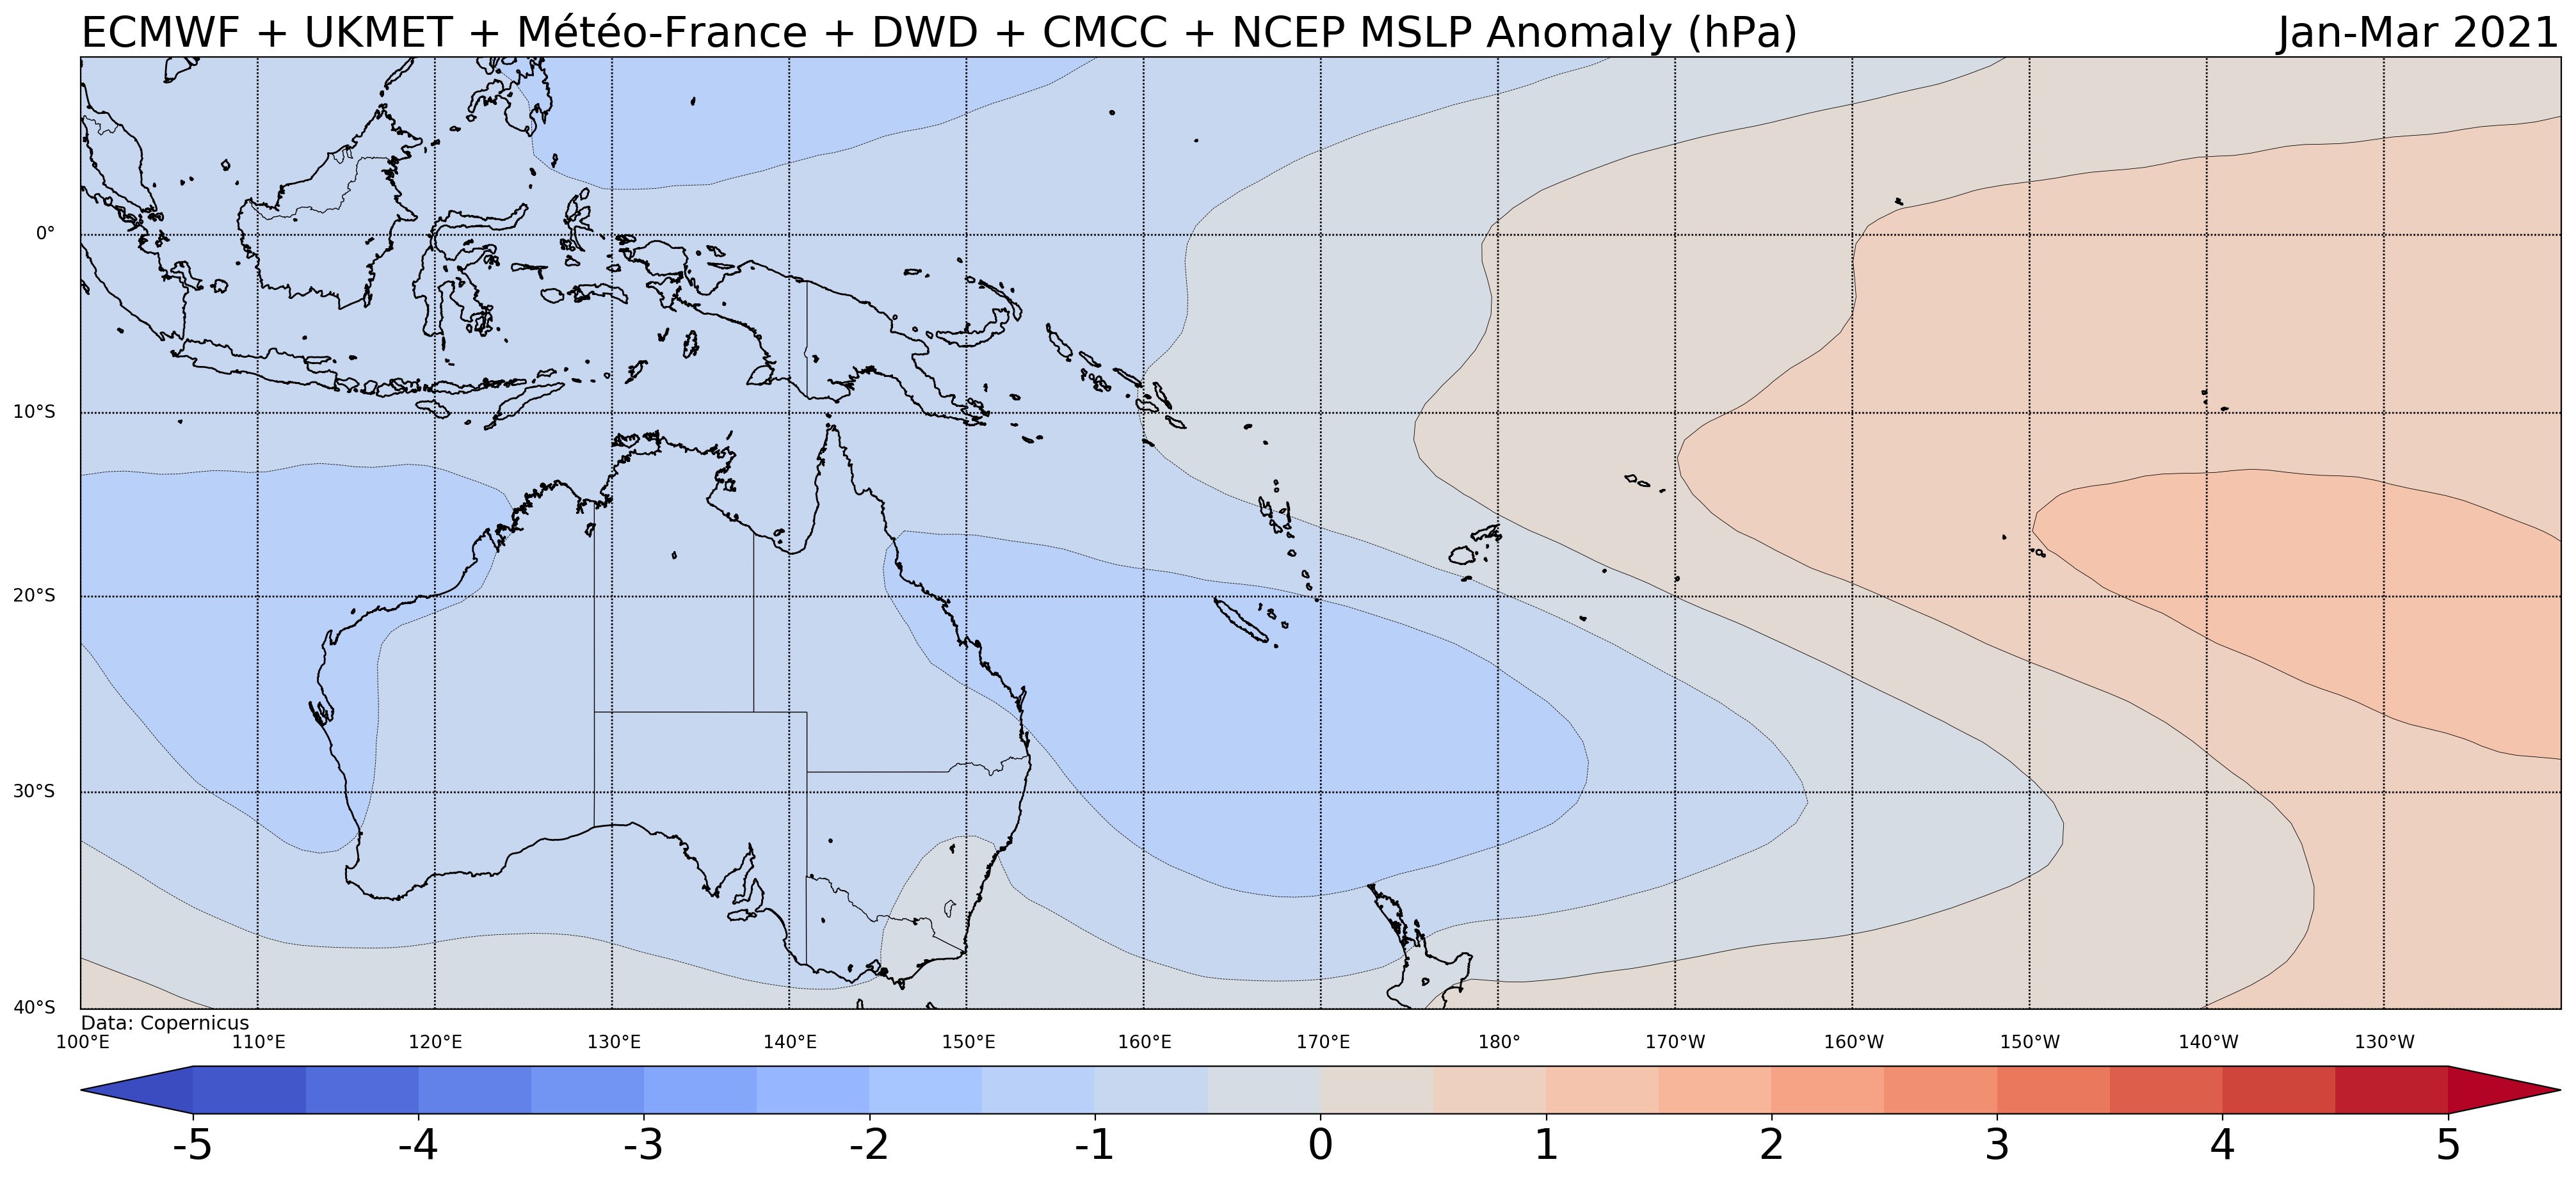
Mean sea level pressure (MSLP) is forecast to be below normal from Papua New Guinea to the Gulf of Carpentaria, across the Coral Sea region, near New Caledonia and Vanuatu, and southward toward northern New Zealand, consistent with La Niña conditions. Near or above normal MSLP is predicted to the east of Fiji, particularly near and east of Samoa and American Samoa (Figure 7 & 8). Model SST, rainfall, and air pressure guidance favour near average TC activity for the 2020/21 Southwest Pacific tropical cyclone season. However, there is the potential for elevated activity near and west of the International Date Line (Vanuatu, New Caledonia, Coral Sea region) with normal or below normal activity to the east.
Deterministic statistical model summary
This is the first year the Long-Range Tropical Cyclone Outlook for the Southwest Pacific (TCO-SP) product is available and we have incorporated it into the ICU outlook to produce a consensus outlook. TCO-SP also provides a different view from analogue and dynamical approaches. The method is calibrated using the IBTrACS data set and several key climate indices for the Southern Hemisphere (see Magee et al., 2020 and the supplementary material for more details). For the coming Southwest Pacific TC season, the deterministic TCO-SP outlook suggests 9 named TCs may form (probable range of 7-10), indicating normal to below normal activity for the basin when compared with the 1981-2010 average of 11.4 TCs (Table 1, Table 4 and Figure 9). This TC count range overlaps with the analogue guidance.
References
Gergis, J., and A. M. Fowler, 2005. Classification of synchronous oceanic and atmospheric El Niño–Southern Oscillation (ENSO) events for palaeoclimate reconstruction. International Journal of Climatology, 25: 1541–1565.
Diamond, H.J., and J.A. Renwick, 2015. The climatological relationship between tropical cyclones in the southwest Pacific and the Madden-Julian Oscillation. International Journal of Climatology, 35: 676-686. doi: 10.1002/joc.4012.
Diamond, H.J., A.M. Lorrey, K.R. Knapp, and D.H. Levinson, 2012. Development of an enhanced tropical cyclone tracks database for the southwest Pacific from 1840-2011. International Journal of Climatology, 32: 2240–2250. doi:10.1002/joc.2412.
Diamond, H.J., A.M. Lorrey, and J.A. Renwick, 2013. A Southwest Pacific tropical cyclone climatology and linkages to the El Niño–Southern Oscillation. Journal of Climate, 26(1): 3-25. doi:10.1175/JCLI-D-12-00077.1.
Leroy, A., and M.C. Wheeler, 2008. Statistical prediction of weekly tropical cyclone activity in the Southern Hemisphere. Monthly Weather Review, 136: 3637-3654.
Lorrey, A.M., G. Griffiths, N. Fauchereau, H.J. Diamond, P.R. Chappell, and J. Renwick, 2014. An ex-tropical cyclone climatology for Auckland, New Zealand. International Journal of Climatology, 34: 1157–1168. doi: 10.1002/joc.3753.
Magee, A.D., Lorrey, A.M., Kiem, A.S., Colyvas, K. 2020. A new island-scale tropical cyclone outlook for southwest Pacific nations and territories. Scientific Reports, 10, 11286, https://doi.org/10.1038/s41598-020-67646-7
Malsale, P. 2011. Analysis of tropical cyclone track sinuosity in the South Pacific region using ARCGIS. Unpublished MSc Thesis, University of the South Pacific, 155 Pages.
Figure 2: Number of TCs occurring for the main development season (November – April) in the Southwest Pacific (135°E to 120°W): (top panel) average number during 1981 to 2010 (normal); (centre panel) average number over selected five analogue seasons (Table 3); (bottom panel) departure from normal for the analogue seasons (difference between count in centre and top panels). For each year noted, that represents the start of the main development season (i.e. 1970 = November 1970-April 1971)
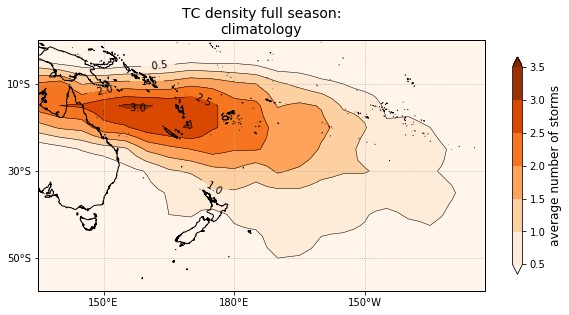
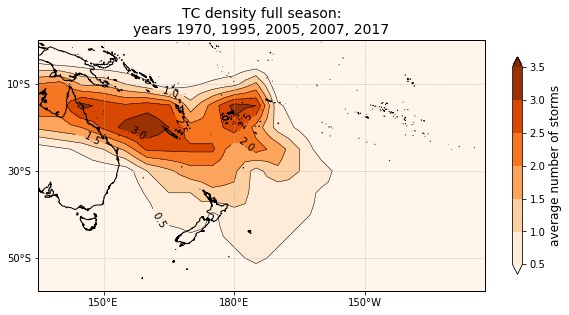
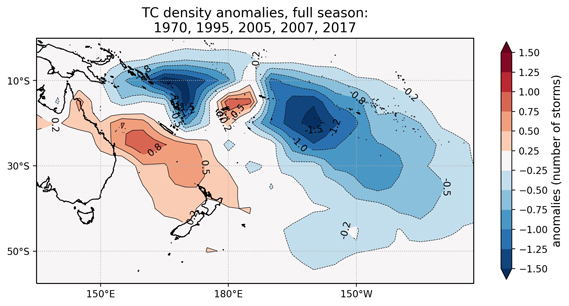
Table 2: The average number of TCs passing close to the main South Pacific Island groups between November and April based on analogue guidance, but contains subjective assessments in some cases to be consistent with the wishes of the national meteorological services involved in generating this regional outlook. In addition, subjective qualification of activity (and associated risk) also recognises the small differences between the actual TC counts for the analogue composites and climatological values. The table is therefore only generally indicative of how many cyclones might be expected for any given island group for the coming season. This information feeds into the final outlook for the season seen in Table 1.
|
Country/Territory |
Climatology |
Analogue seasons |
Cyclone spread |
Anomaly |
% Difference |
Risk |
|
New Caledonia |
2.75 |
3.0 |
3-4 |
0.25 |
10 |
Elevated |
|
Fiji |
2.5 |
3.0 |
2-3 |
0.5 |
20 |
Normal |
|
Vanuatu |
2.9 |
2.3 |
2-3 |
-0.6 |
-20 |
Normal |
|
Wallis & Futuna |
2.2 |
2.7 |
2-3 |
0.5 |
20 |
Normal |
|
N. New Zealand |
0.75 |
2.0 |
1-2 |
1.25 |
170 |
Elevated |
|
Tokelau |
1.6 |
2.0 |
1-2 |
0.6 |
25 |
Normal-elevated |
|
Samoa |
1.7 |
1.2 |
1-2 |
-0.5 |
40 |
Normal |
|
Tonga |
2.2 |
1.4 |
1-2 |
-0.8 |
-35 |
Reduced |
|
Solomon Is. |
1.2 |
1 |
0-1 |
-0.2 |
-15 |
Normal |
|
Papua New Guinea |
0.9 |
1 |
0-1 |
0.1 |
10 |
Normal |
|
Tuvalu |
1.4 |
0.6 |
0-1 |
-0.8 |
-60 |
Reduced |
|
Niue |
1.8 |
0.4 |
0-1 |
-1.4 |
-80 |
Reduced |
|
American Samoa |
1.7 |
0.2 |
0-1 |
-1.5 |
-90 |
Reduced |
|
S. Cooks |
1.3 |
0.2 |
0-1 |
-1.1 |
-85 |
Reduced |
|
Austral Is. |
0.75 |
0 |
0 |
-0.75 |
135 |
Reduced |
|
Society Is. |
0.7 |
0 |
0 |
-0.7 |
N/A |
Unlikely |
|
N. Cooks |
0.5 |
0 |
0 |
-0.5 |
N/A |
Unlikely |
|
Tuamotu |
0.2 |
0 |
0 |
-0.2 |
N/A |
Unlikely |
|
W. Kiribati |
0.1 |
0 |
0 |
-0.1 |
N/A |
Unlikely |
|
Marquesas |
0.1 |
0 |
0 |
-0.1 |
N/A |
Unlikely |
|
Pitcairn |
0 |
0 |
0 |
0 |
N/A |
Unlikely |
|
C. Kiribati |
0 |
0 |
0 |
0 |
N/A |
Unlikely |
|
E. Kiribati |
0 |
0 |
0 |
0 |
N/A |
Unlikely |
Table 3: Previous analogue seasons and intensity of TCs that occurred in the Southwest Pacific during the November-April TC season . Categorisation of cyclones aligns to the Australian Bureau of Meteorology (BoM) scale.
|
Season |
Number of named cyclones |
Right: TC category (BoM scale) |
Cat 1 |
Cat 2 |
Cat 3 |
Cat 4 |
Cat 5 |
|
1970-71 |
9 |
3 |
5 |
1 |
|||
|
1995-96 |
10 |
6 |
1 |
1 |
2 |
||
|
2005-06 |
8 |
1 |
2 |
3 |
1 |
1 |
|
|
2007-08 |
6 |
1 |
1 |
2 |
2 |
||
|
2017-18 |
8 |
3 |
1 |
2 |
1 |
1 |
|
|
Mean total |
8.2 |
2.8 |
2.0 |
1.8 |
1.2 |
0.4 |
|
|
Rounded mean totals |
9 |
3 |
2 |
2 |
1 |
1 |
Analogue guidance summary:
Based on the guidance from the NIWA analogue method, a conservative range of 8-10 named TCs could be expected during the 2020/21 season for the Southwest Pacific basin (135° E – 120° W). The spread for the estimated cyclone activity comes from the variation between five selected analogue seasons. The historic long-term seasonal average is just over 10 named cyclones for the SW Pacific basin. There is relatively low disagreement between the analogues for the total number of cyclones for this season, with the one exception being the 2007/08 season.
A potential combination of 3-4 cyclones may reach severe category 3 or higher status. The long-term TC climatology and the analogues we have identified indicate that a category 5 cyclone may occur (see Table 3). Four of the five historic analogue seasons indicate more than one cyclone of category 4 strength or higher could occur. A majority of the historic analogues selected for the 2020/21 outlook (four out of five) indicate multiple severe TCs (at least three or more) that were equivalent to or greater than category 3 occurred in seasons similar to the present. This provides confidence in the statistical outlook for expected cyclone strengths, and support for a conservative range of 3-4 severe tropical cyclones for this outlook. We have subjectively rounded the total mean count upward from 8.2 to 9 this season to include the possibility of a category 5 cyclone based on current conditions and expected outcomes for the coming season.
For the selected analogues, all of the analogue years show at least one ex-tropical cyclone came within 550 km of New Zealand. The rounded average interaction for New Zealand with an ex-tropical cyclone is two named systems per season. Some of the decaying ex-tropical cyclone systems were also associated with high rainfall, damaging winds and amplified coastal wave conditions. The risk of an interaction for New Zealand (with at least one cyclone coming within 550 km of the country) for the 2020/21 season is elevated. There is an equal probability of a decaying ex-tropical cyclone tracking to the east or west of the North Island based on historic track data (Figure 3).
Figure 3: Plots of TC tracks and major tropical lows that were monitored for analogue seasons used in the 2020/21 seasonal forecast for the full season (November - April). Track data are courtesy of International Best Tracks Archive for Climate Stewardship (IBTrACS).
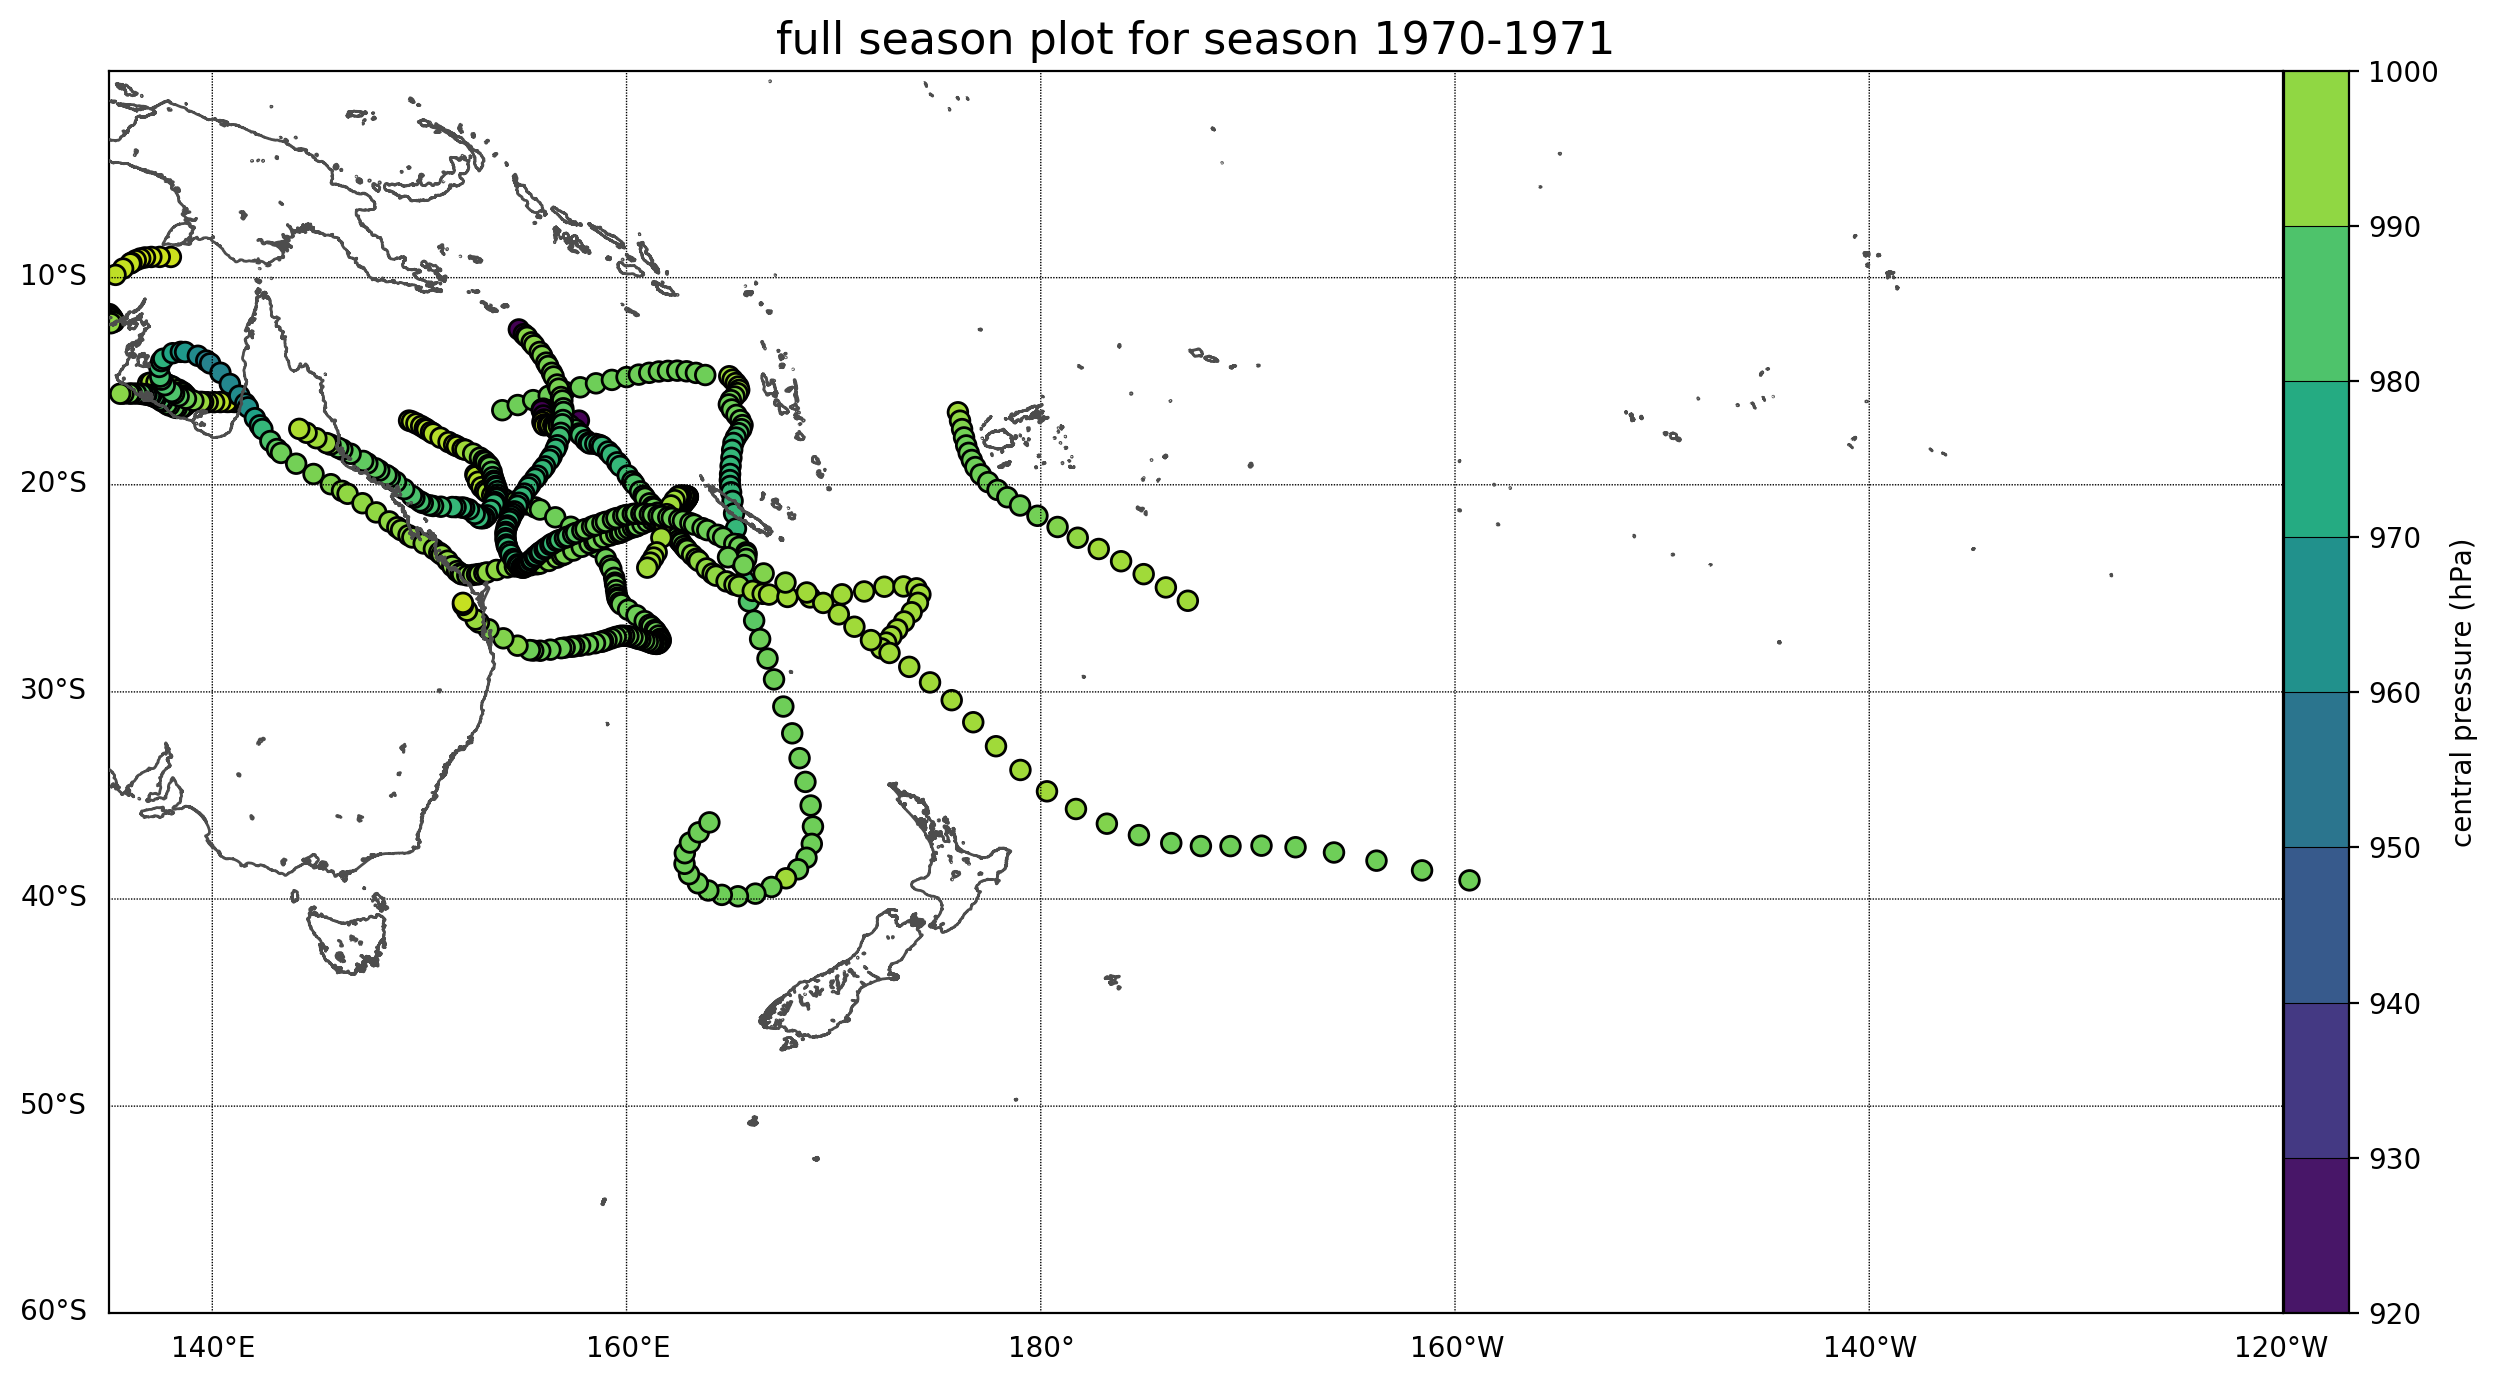

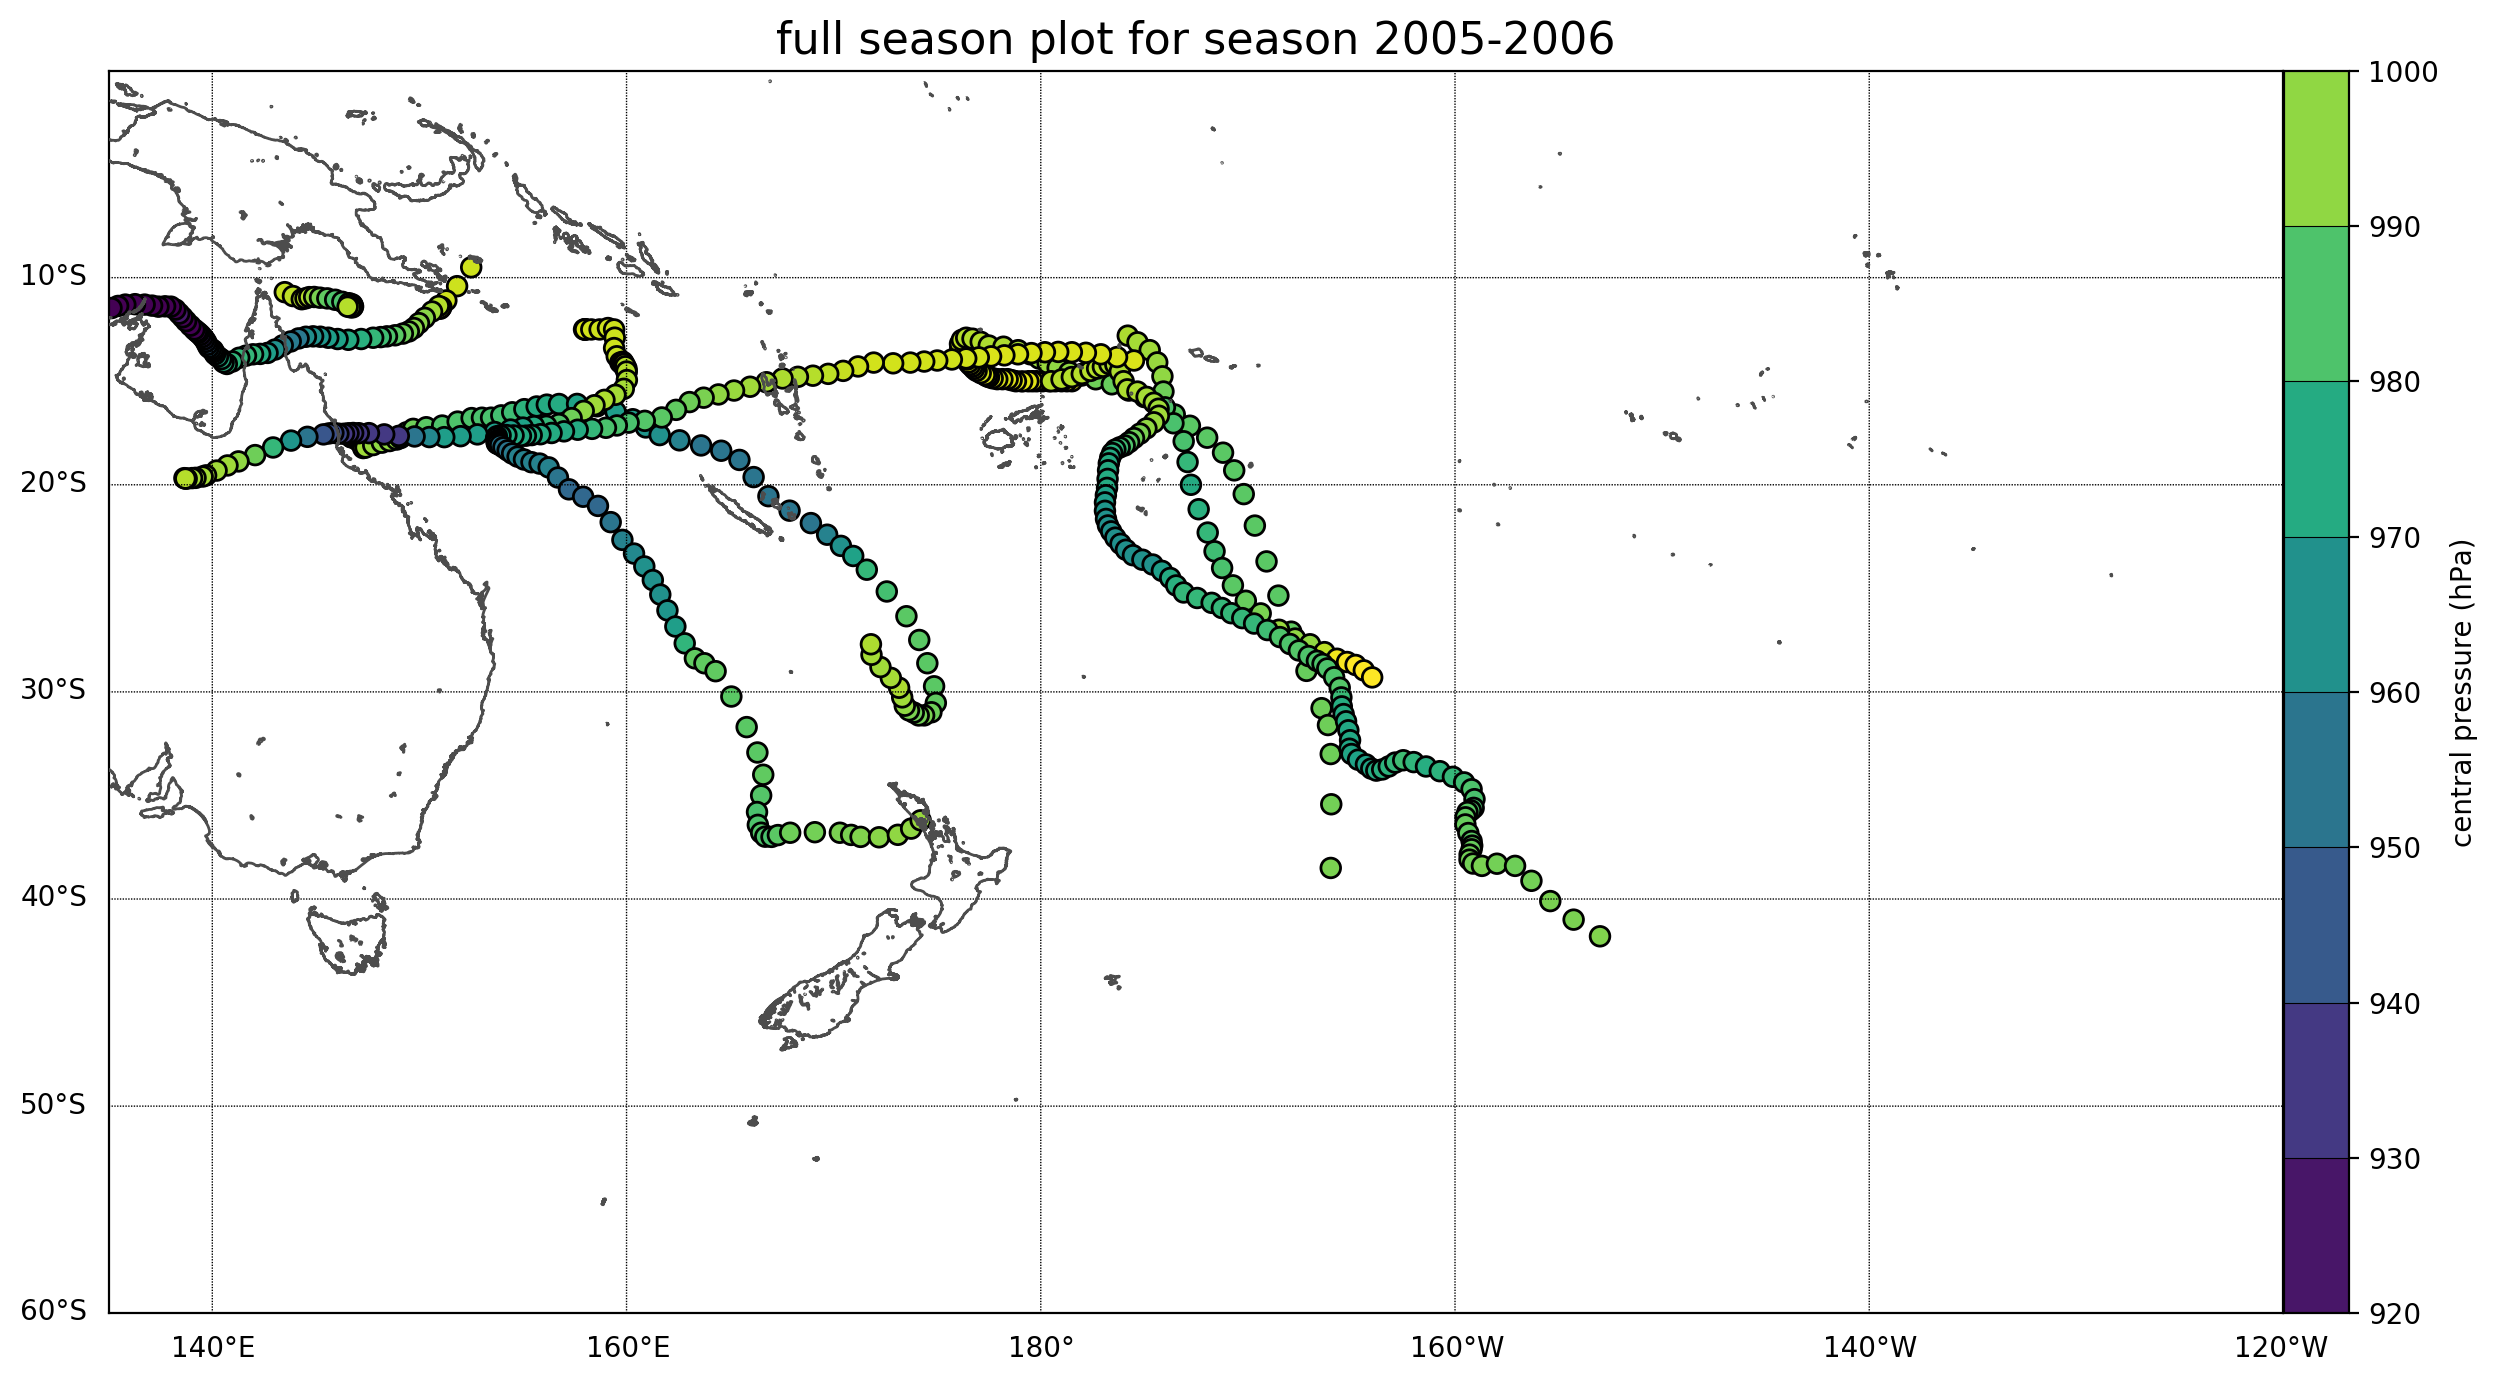
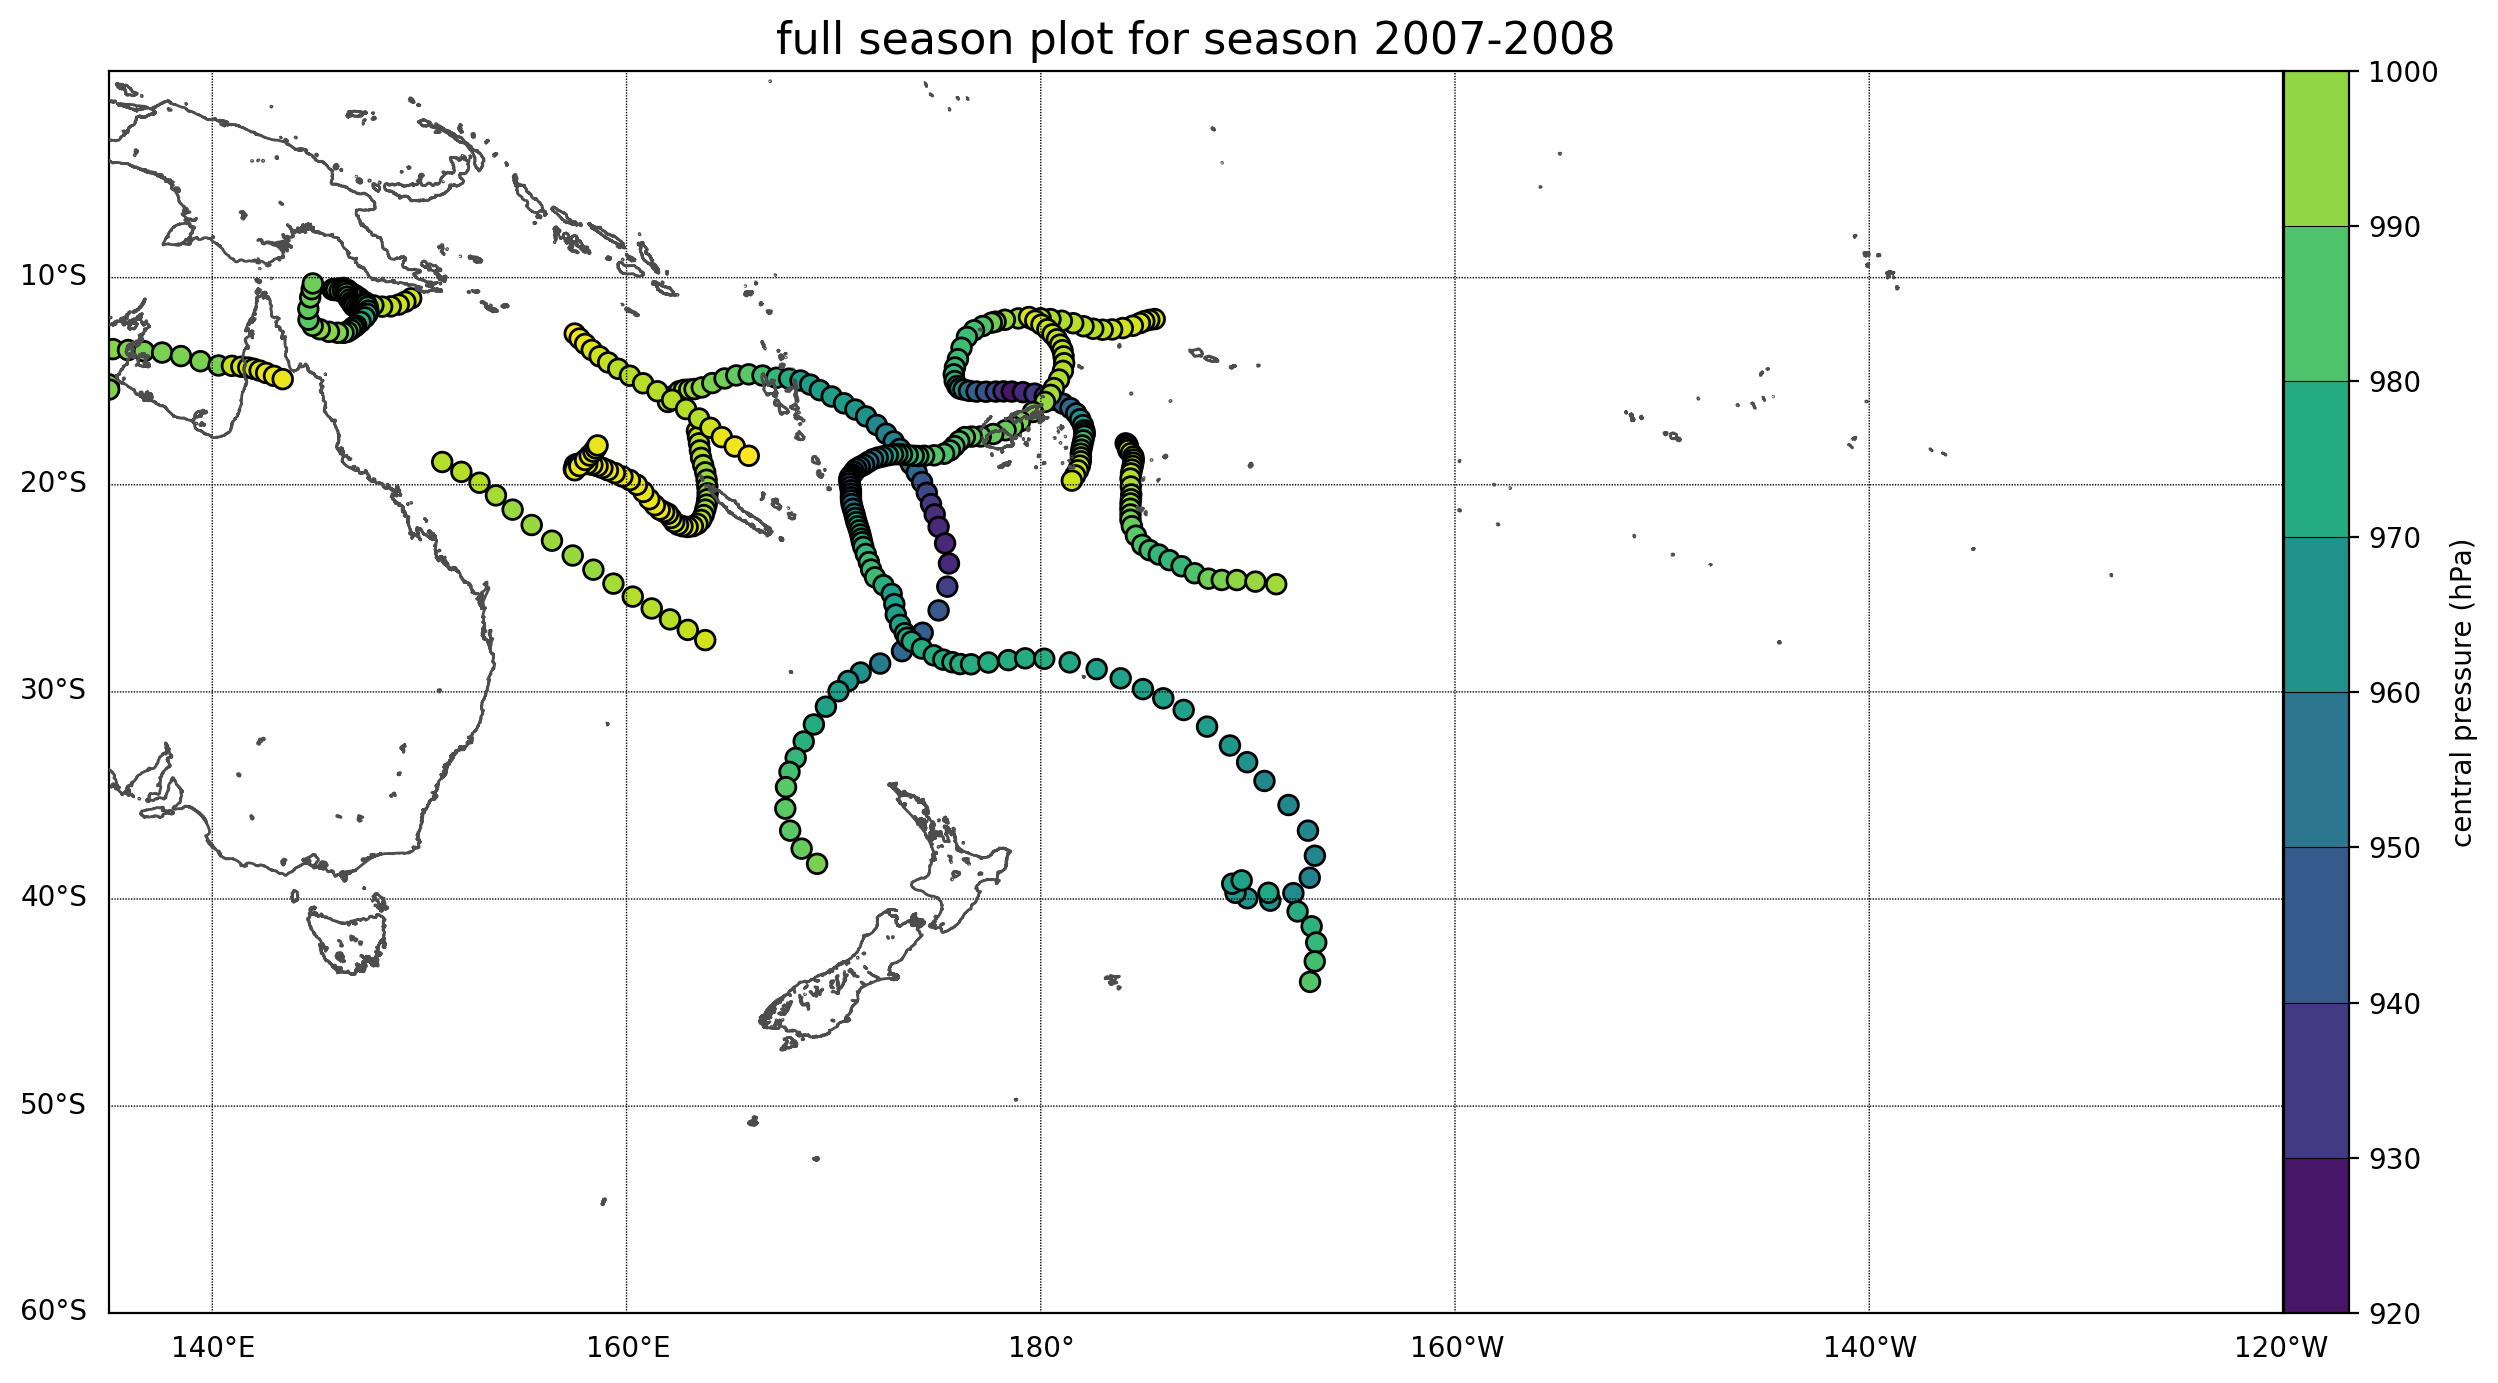
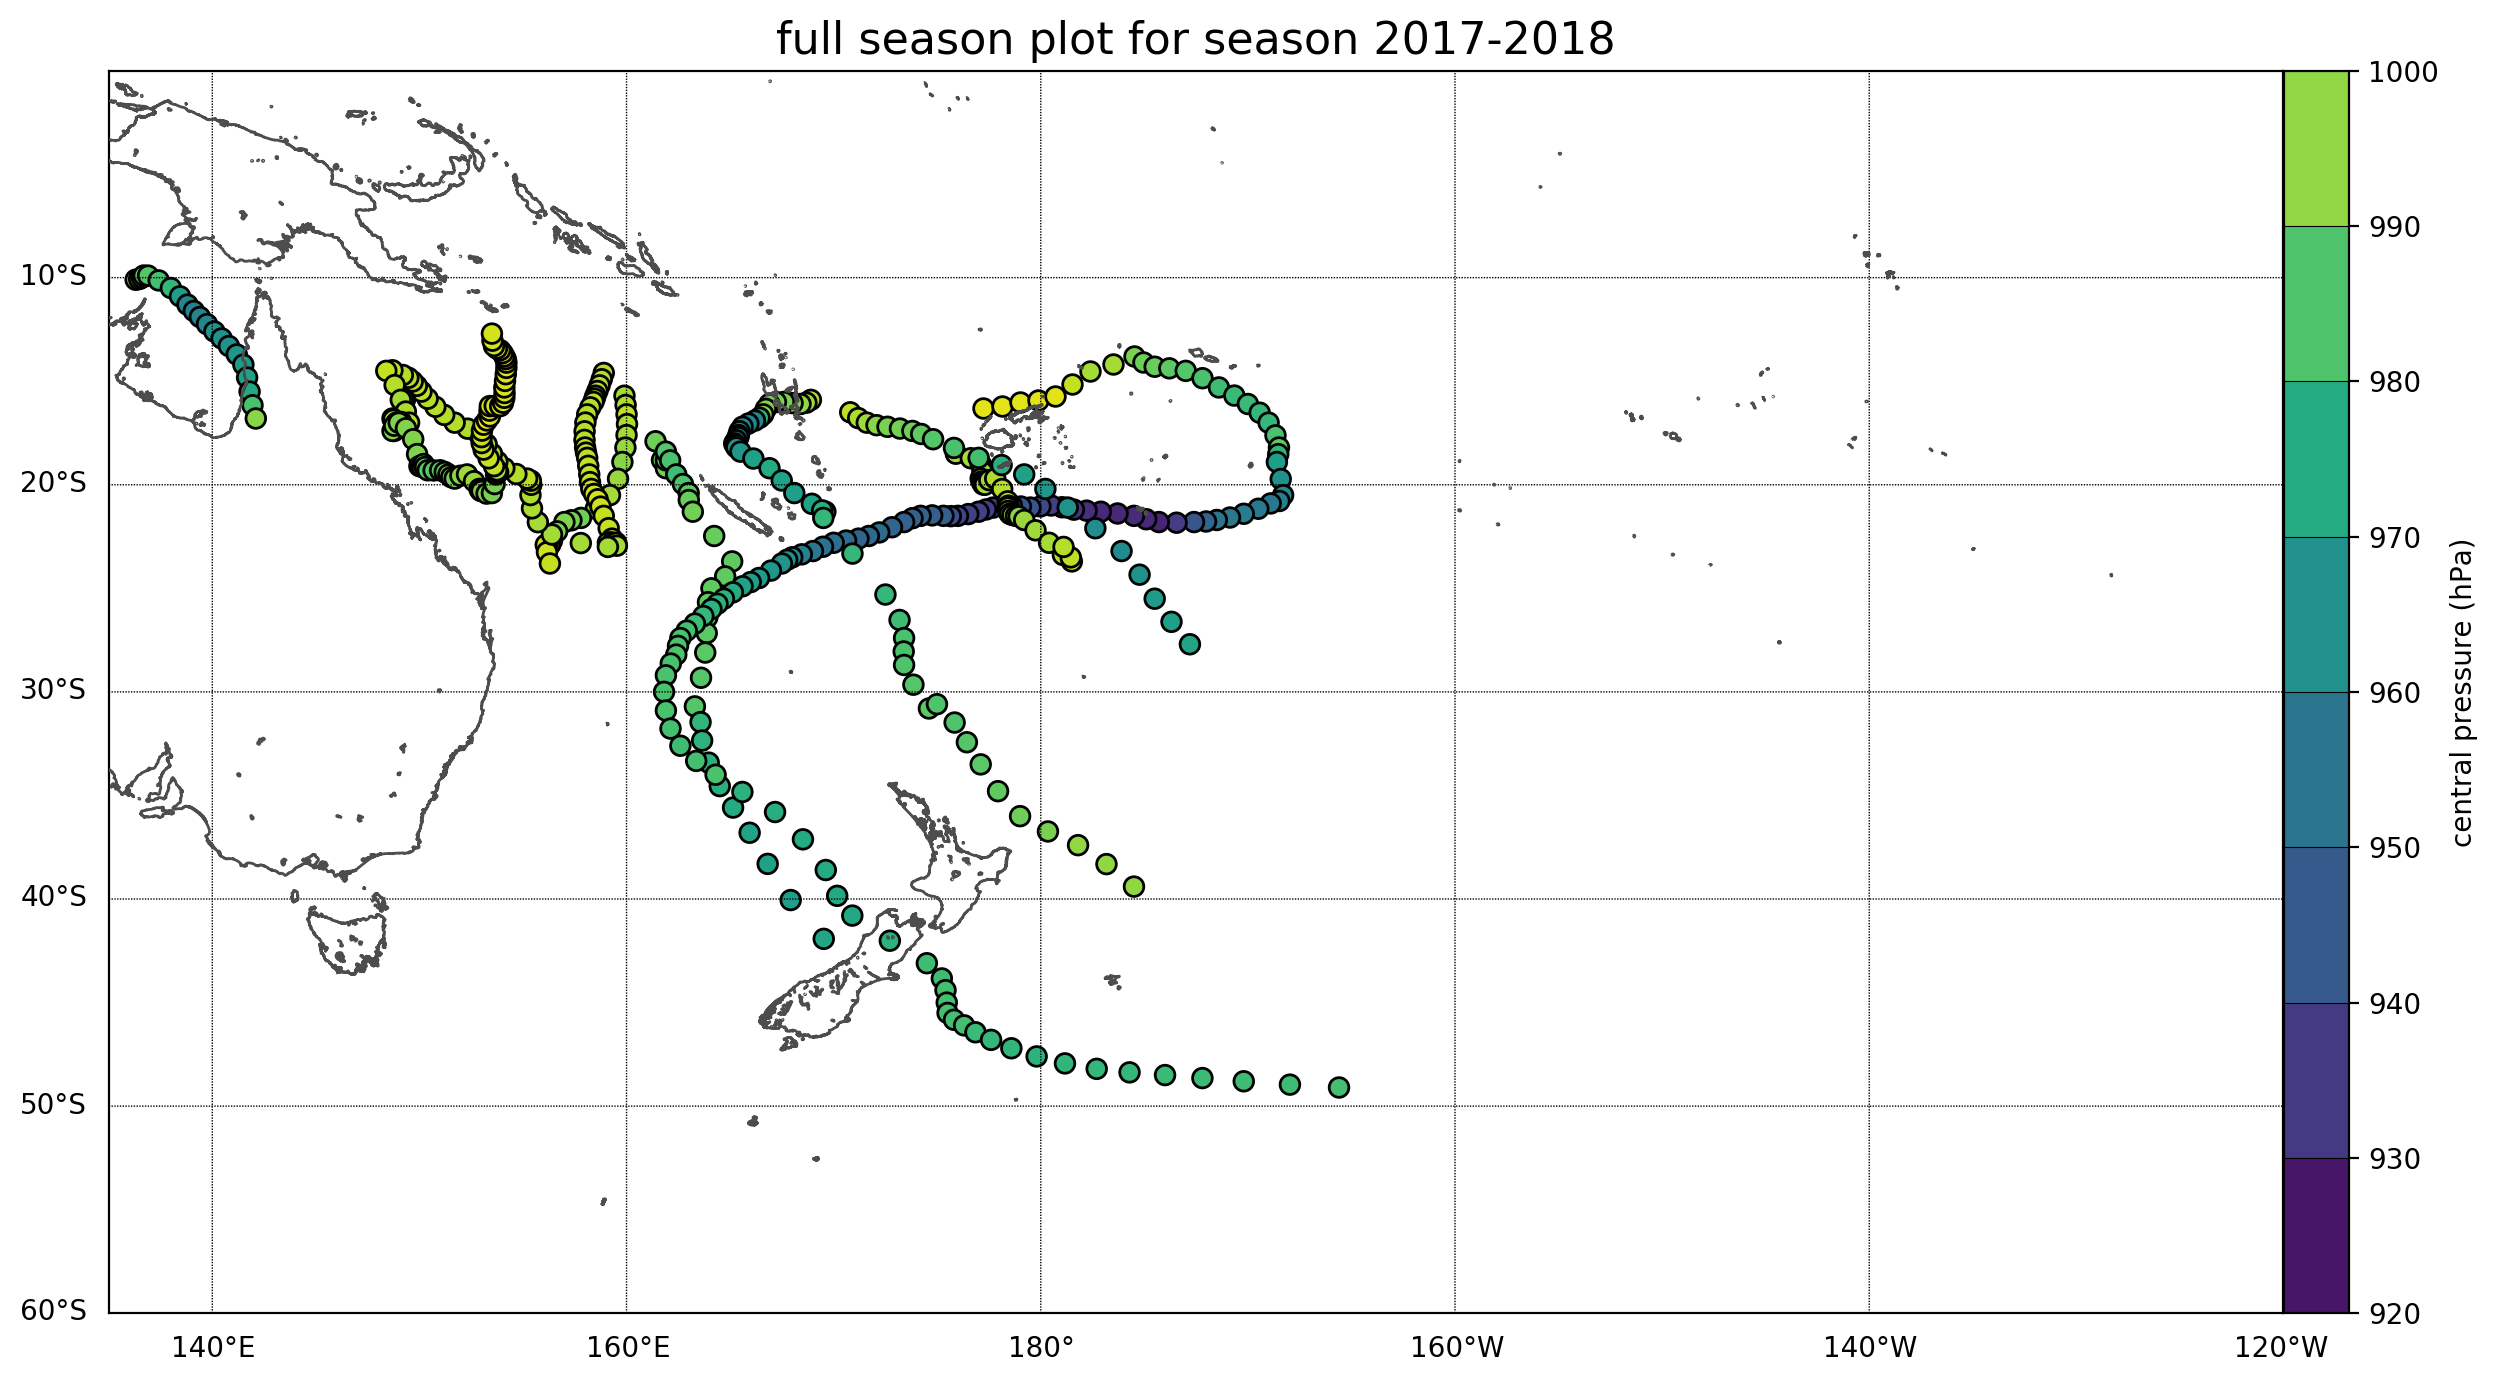
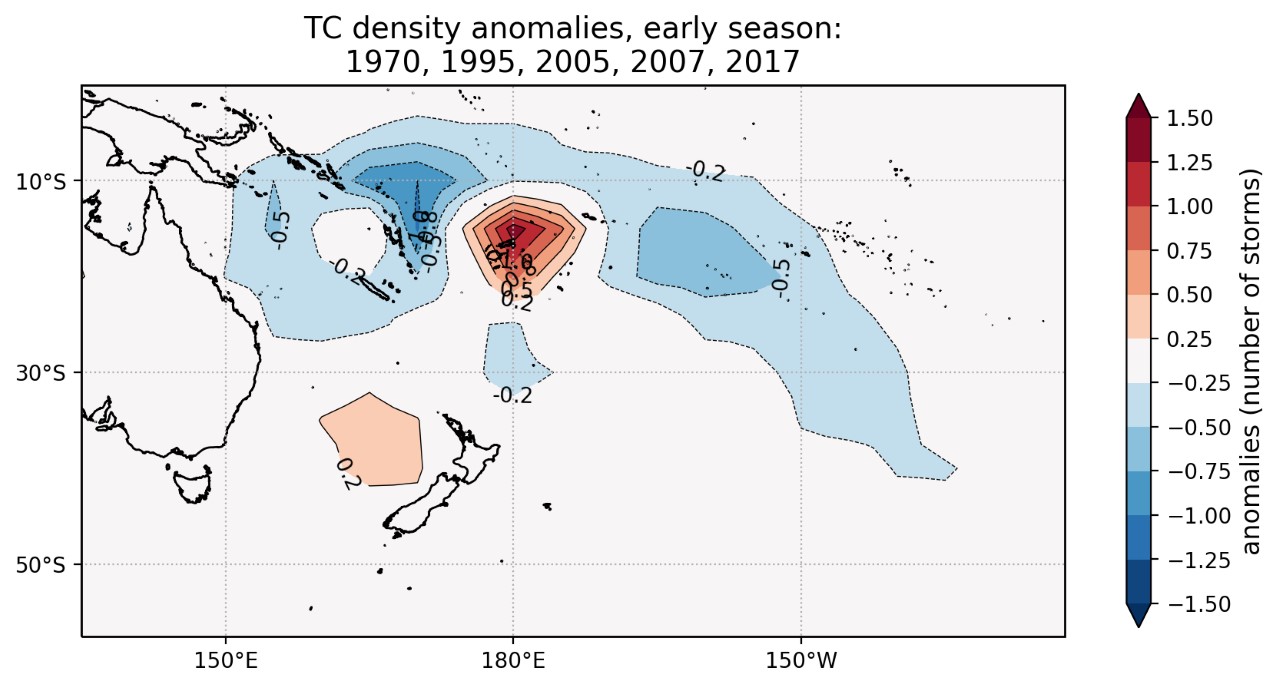
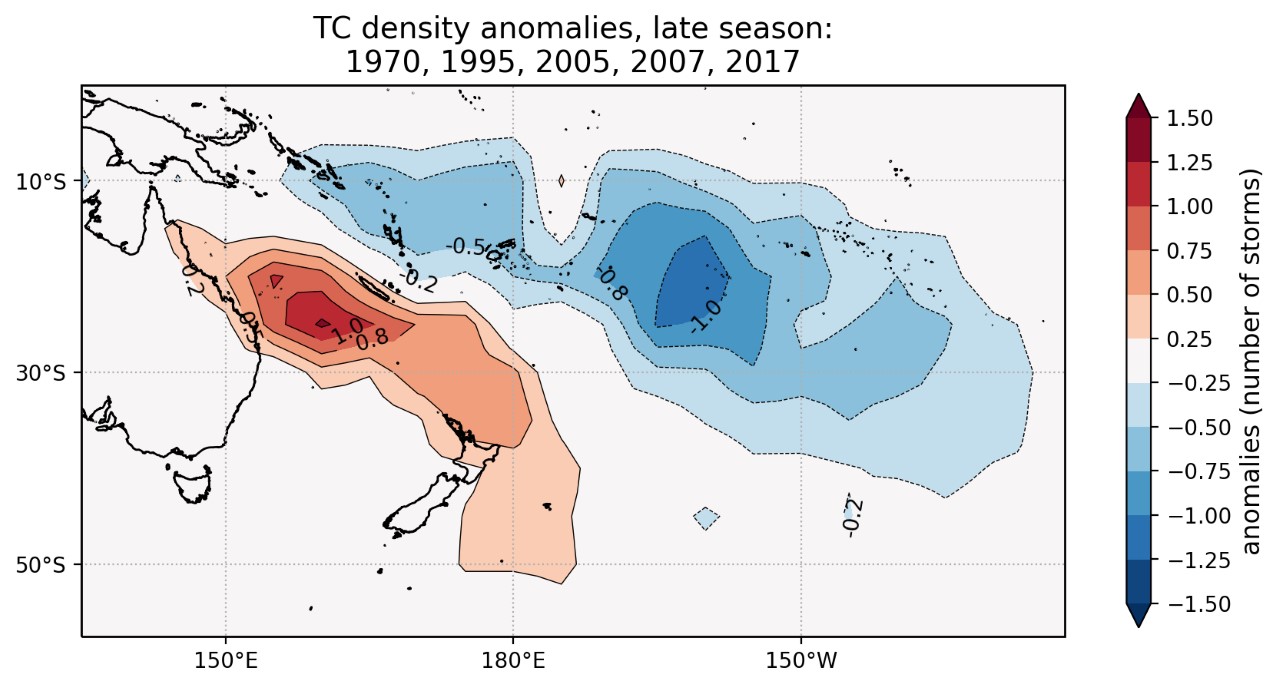
Figure 4: Early season (November to January; top panel) and late season (February to April; bottom panel) anomaly plots for selected TC analogue seasons (data courtesy of International Best Tracks Archive for Climate Stewardship (IBTrACS). The year label notes the first month in the analogue year selection (i.e. for the early TC season “1970” = November 1970, December 1970, January 1971; and for the late TC season “1970” = February – April 1971).
Dynamical Guidance Summary
A synthesis of model atmospheric and SST guidance favour near average TC activity for the 2020/21 Southwest Pacific tropical cyclone season. However, there is the potential for elevated activity near and west of the International Date Line (Vanuatu, New Caledonia, Coral Sea region) with normal or below normal activity to the east. Near normal activity is forecast to extend from the Solomon Islands to Niue (including Fiji and Tonga) with pockets of below normal activity farther to the east (Samoa, American Samoa, Cook Islands). An area of normal to above normal activity is indicated by some of the guidance about French Polynesia.
ECMWF seasonal guidance, November 2020-April 2021
The Accumulated Cyclone Energy, or ACE forecast: ECMWF seasonal guidance indicates 80% (near normal amounts) of seasonal accumulated cyclone energy, a metric derived from tropical cyclone intensity and duration, across the basin as a whole.
Tropical storm (cyclone) density anomaly forecast to be near or above normal from the Gulf of Carpentaria to the International Date Line and near or below normal to the east.
Tropical storm (cyclone) and hurricane frequency (category 3 or higher): ECMWF seasonal guidance indicates a near normal amount of severe TCs. However, it is worth noting that the 2020 October-initialised guidance indicates more severe TC activity than the October-initialised guidance before each of the last three TC seasons.
Collectively, this supports a near normal number of TCs (category 1 or higher) and at least a near normal amount of severe TCs (category 3 or higher) across the Southwest Pacific basin for the 2020/21 tropical cyclone season.
The dynamical guidance generally agrees with the analogue guidance for TC count and severity, but has two distinct clusters of above normal amounts of activity (Coral Sea and south of Vanuatu and Fiji). The analogue guidance has one primary cluster of enhanced activity extending from the Coral Sea to the south of New Caledonia.
NB: The ECMWF forecast domain for ACE is from 160˚E to 120˚W. The Southwest Pacific basin covers 135˚E to 120˚W, therefore the forecast generated by NIWA extends 25˚ westward than the ECMWF forecast domain.
Figure 5. Multi-model ensemble forecast rainfall anomaly (mm/day), October-December 2020; green (brown) shades indicate above (below) normal forecast rainfall
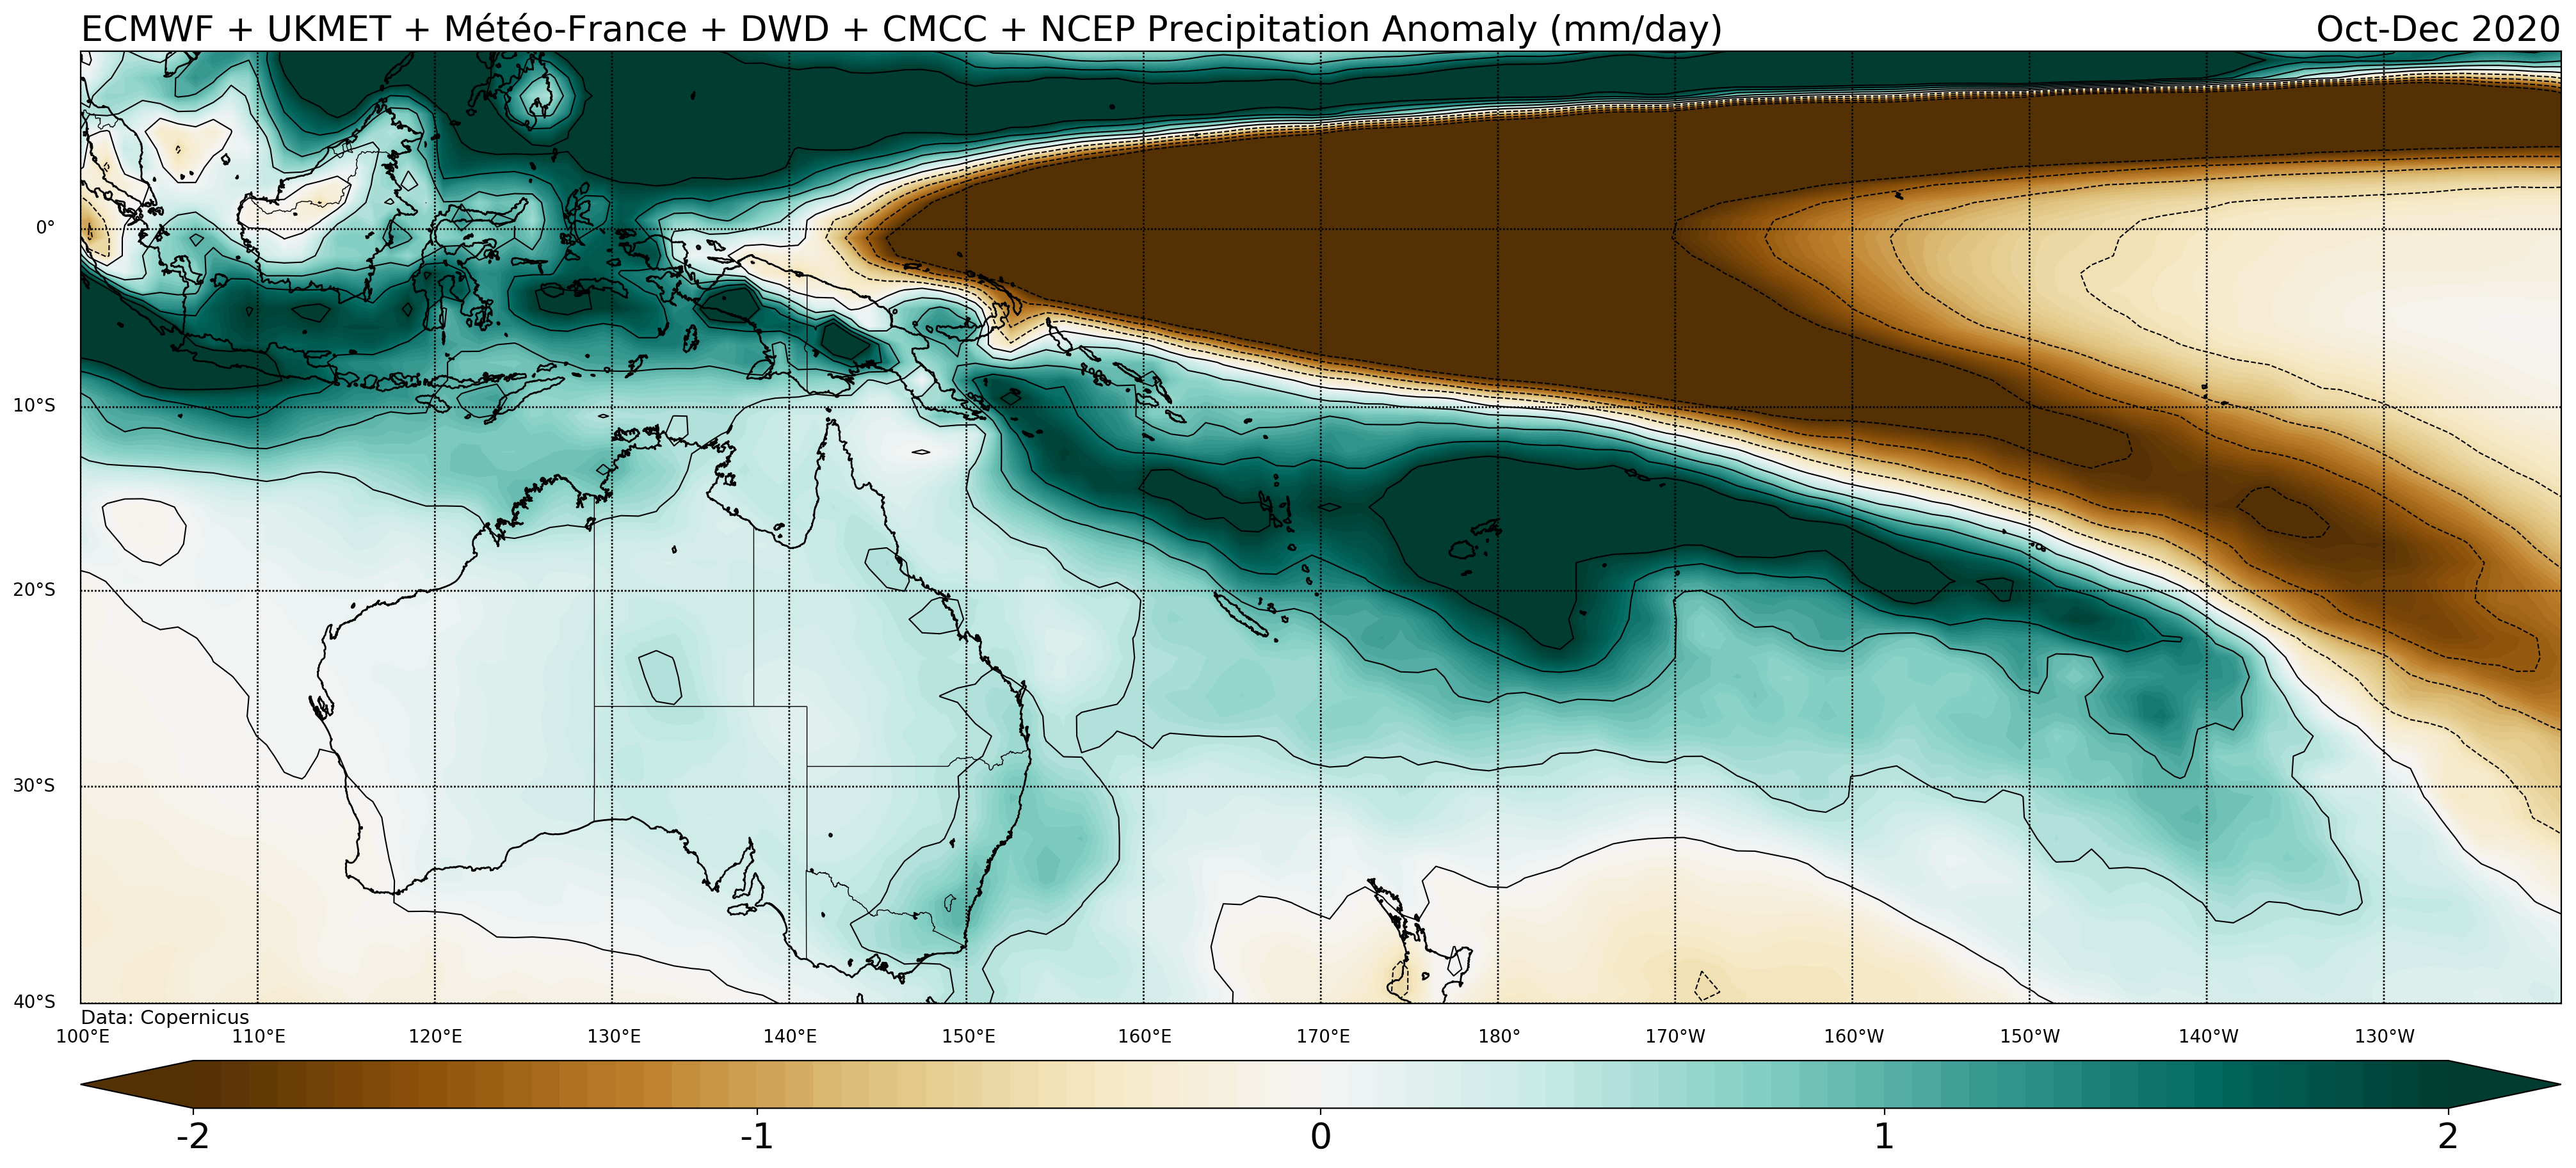
Figure 6. Multi-model ensemble forecast rainfall anomaly (mm/day), January-March 2021; green (brown) shades indicate above (below) normal forecast rainfall
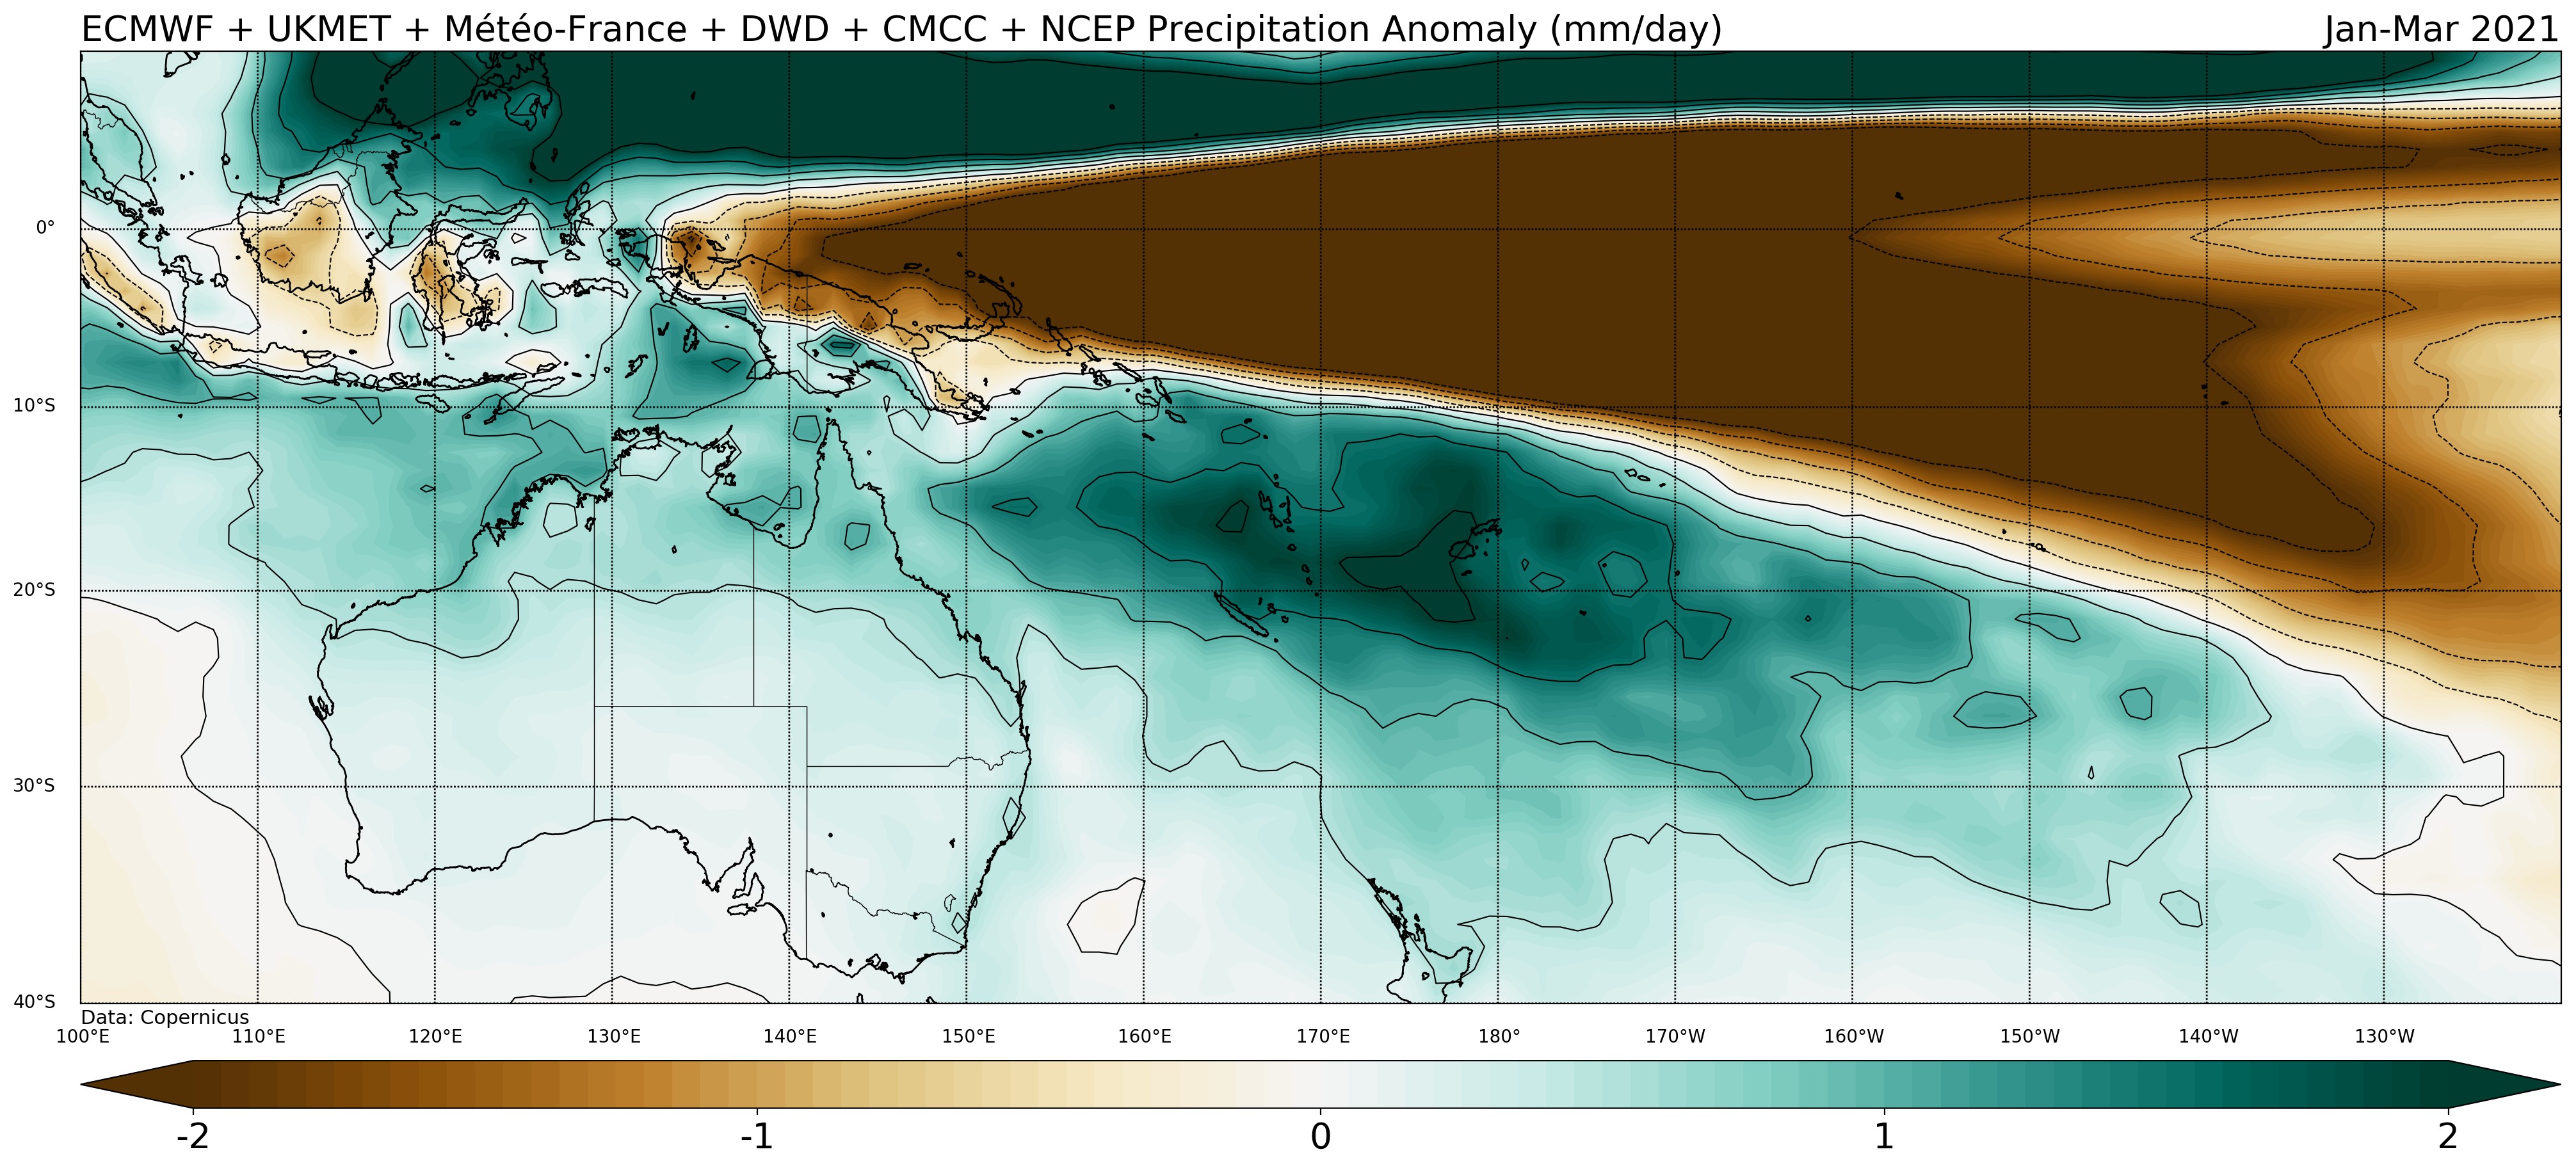
Figure 7. Multi-model ensemble forecast air pressure anomaly (hPa), October-December 2020; red (blue) shades indicate above (below) normal air pressure; areas of below normal pressure in the tropics can indicate an increased potential for tropical cyclone genesis
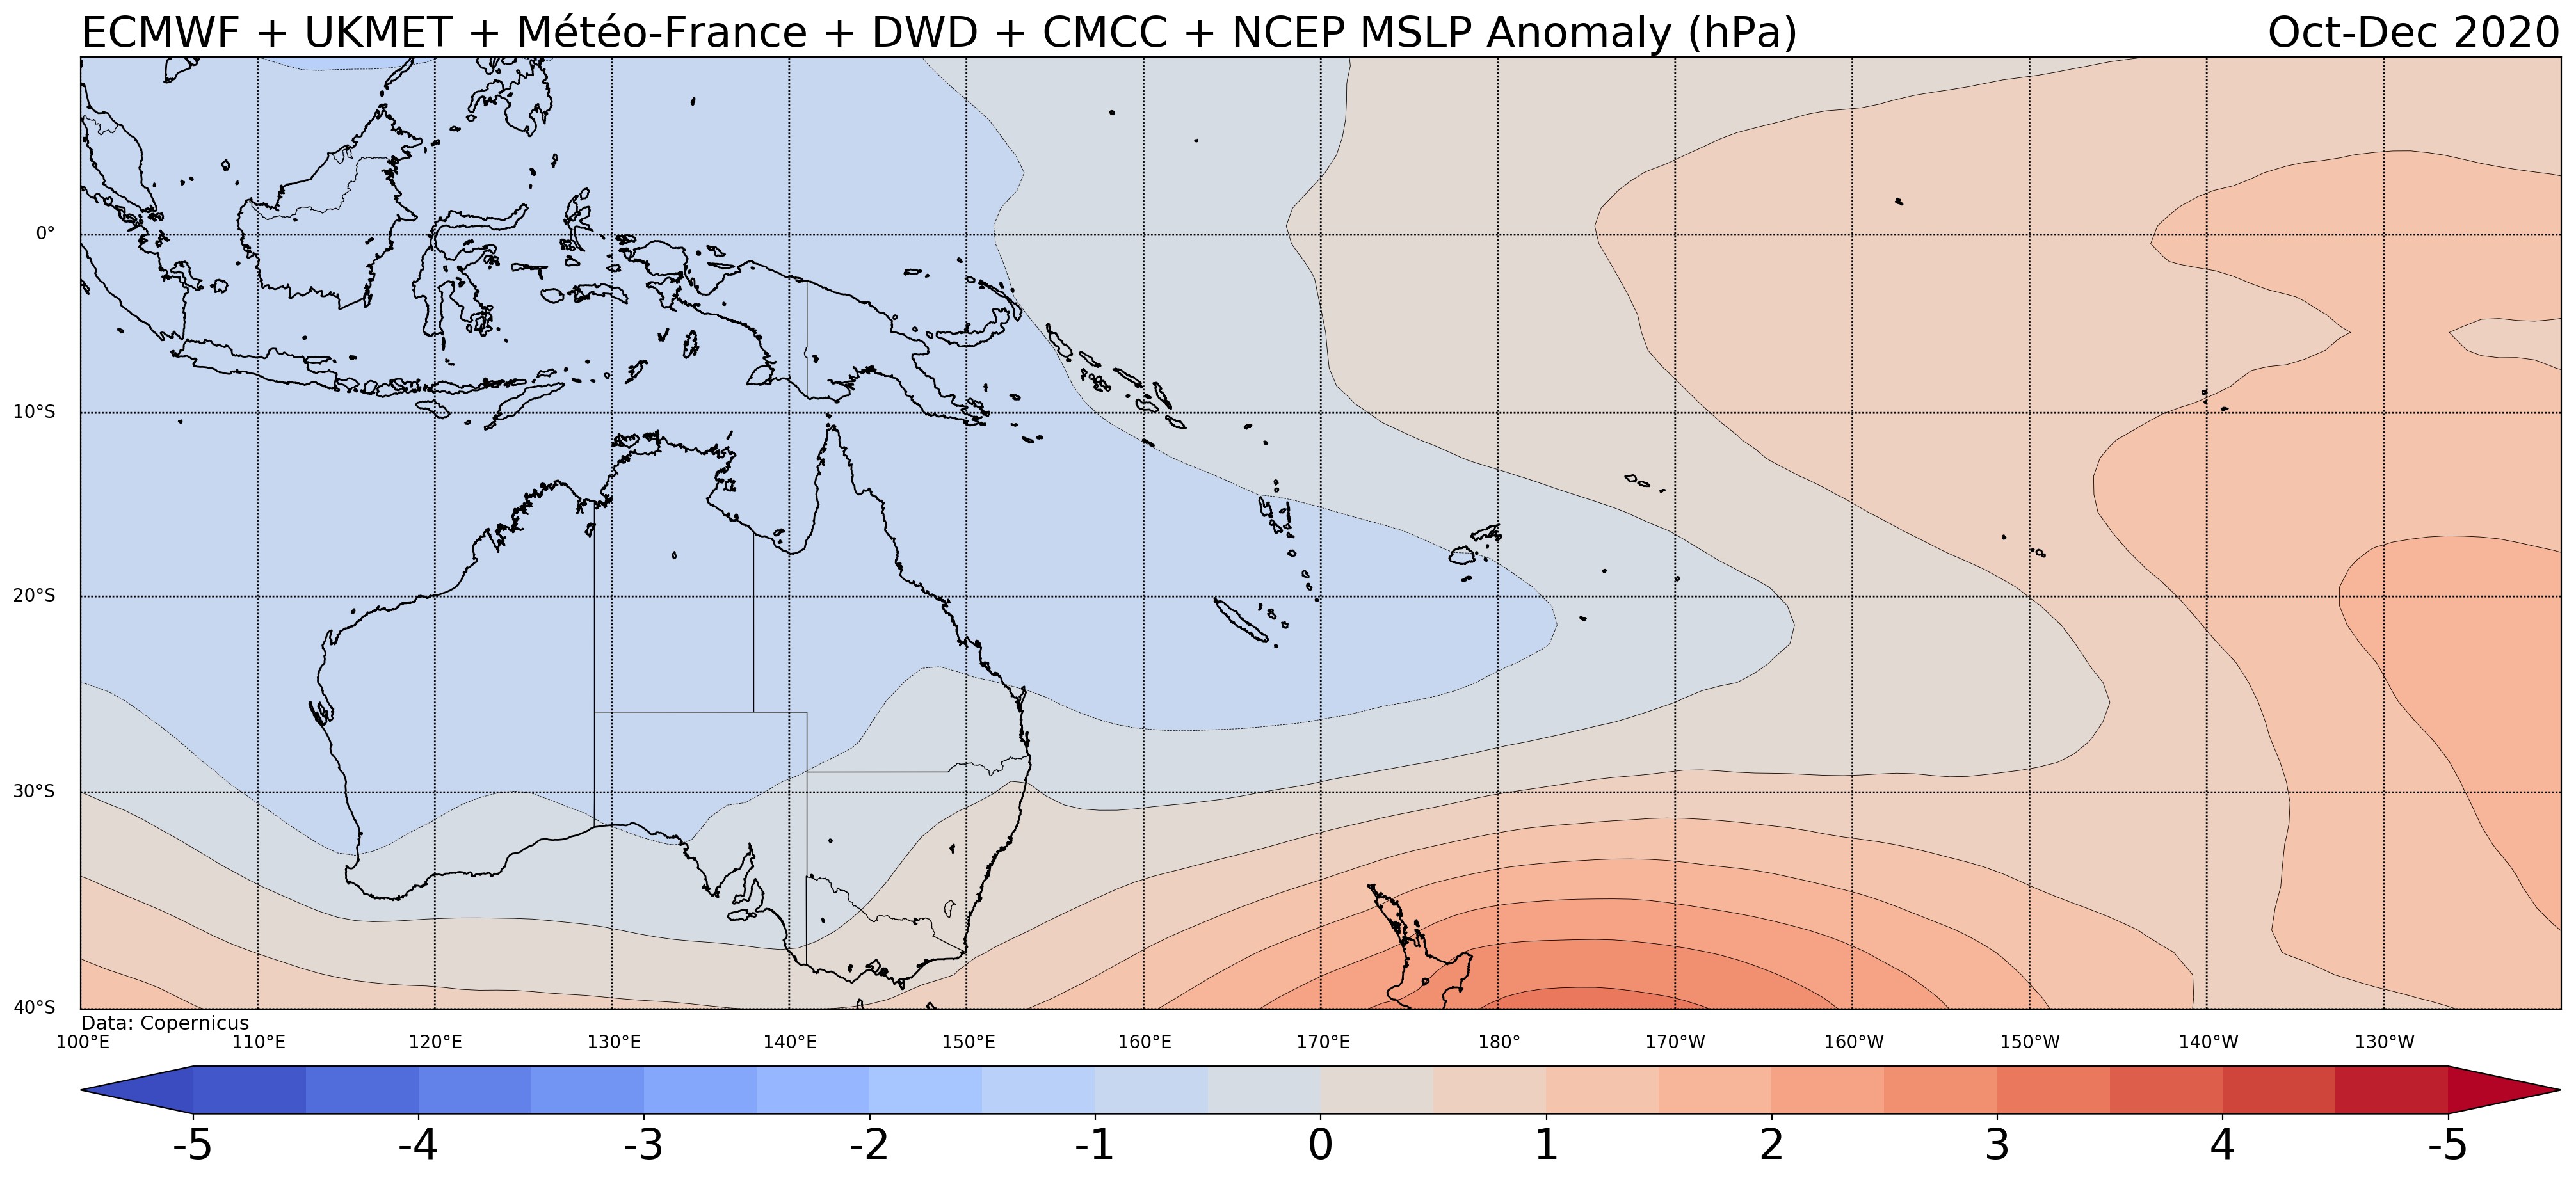
Figure 8. Multi-model ensemble forecast air pressure anomaly (hPa), January-March 2021; red (blue) shades indicate above (below) normal air pressure; areas of below normal pressure in the tropics can indicate an increased potential for tropical cyclone genesis
Information about the dynamical models used
Information on ECMWF model skill can be found here for: tropical cyclones, severe tropical cyclones, and ACE. An overview of the multi-model Copernicus ensemble used to create the rainfall and air pressure plots can be found here.
TCO-SP (University of Newcastle) deterministic model summary
TCO-SP is a long-range tropical cyclone outlook based on a multi-variate statistical method generated using Poisson Regression (Magee et al., 2020) recently published in Scientific Reports. This is the first year the product is available and we have incorporated it into the ICU outlook because it provides a different view from analogue and dynamical approaches. For the coming 2020/21 season, the deterministic TCO-SP outlook for Southwest Pacific TC season suggests 9 named TCs will form (probable range of 7-10), indicating normal to below normal activity for the basin when compared with the 1981-2010 average of 11.4 TCs (Table 4 and Figure 9). See https://tcoutlook.com/swpacific/ for more details related to this part of the outlook.
Table 4: Expected TC counts including expected range (95% confidence intervals (CI)) for the 2020/21 Southwest Pacific tropical cyclone season (October 2020 update), difference from long term average TC count (1981-2010).
|
|
|
Long-term average TC count (1981-2010b) |
Expected TC Count (Probable TC count range: 95% CI) |
Difference between expected and long-term average (TC) |
|
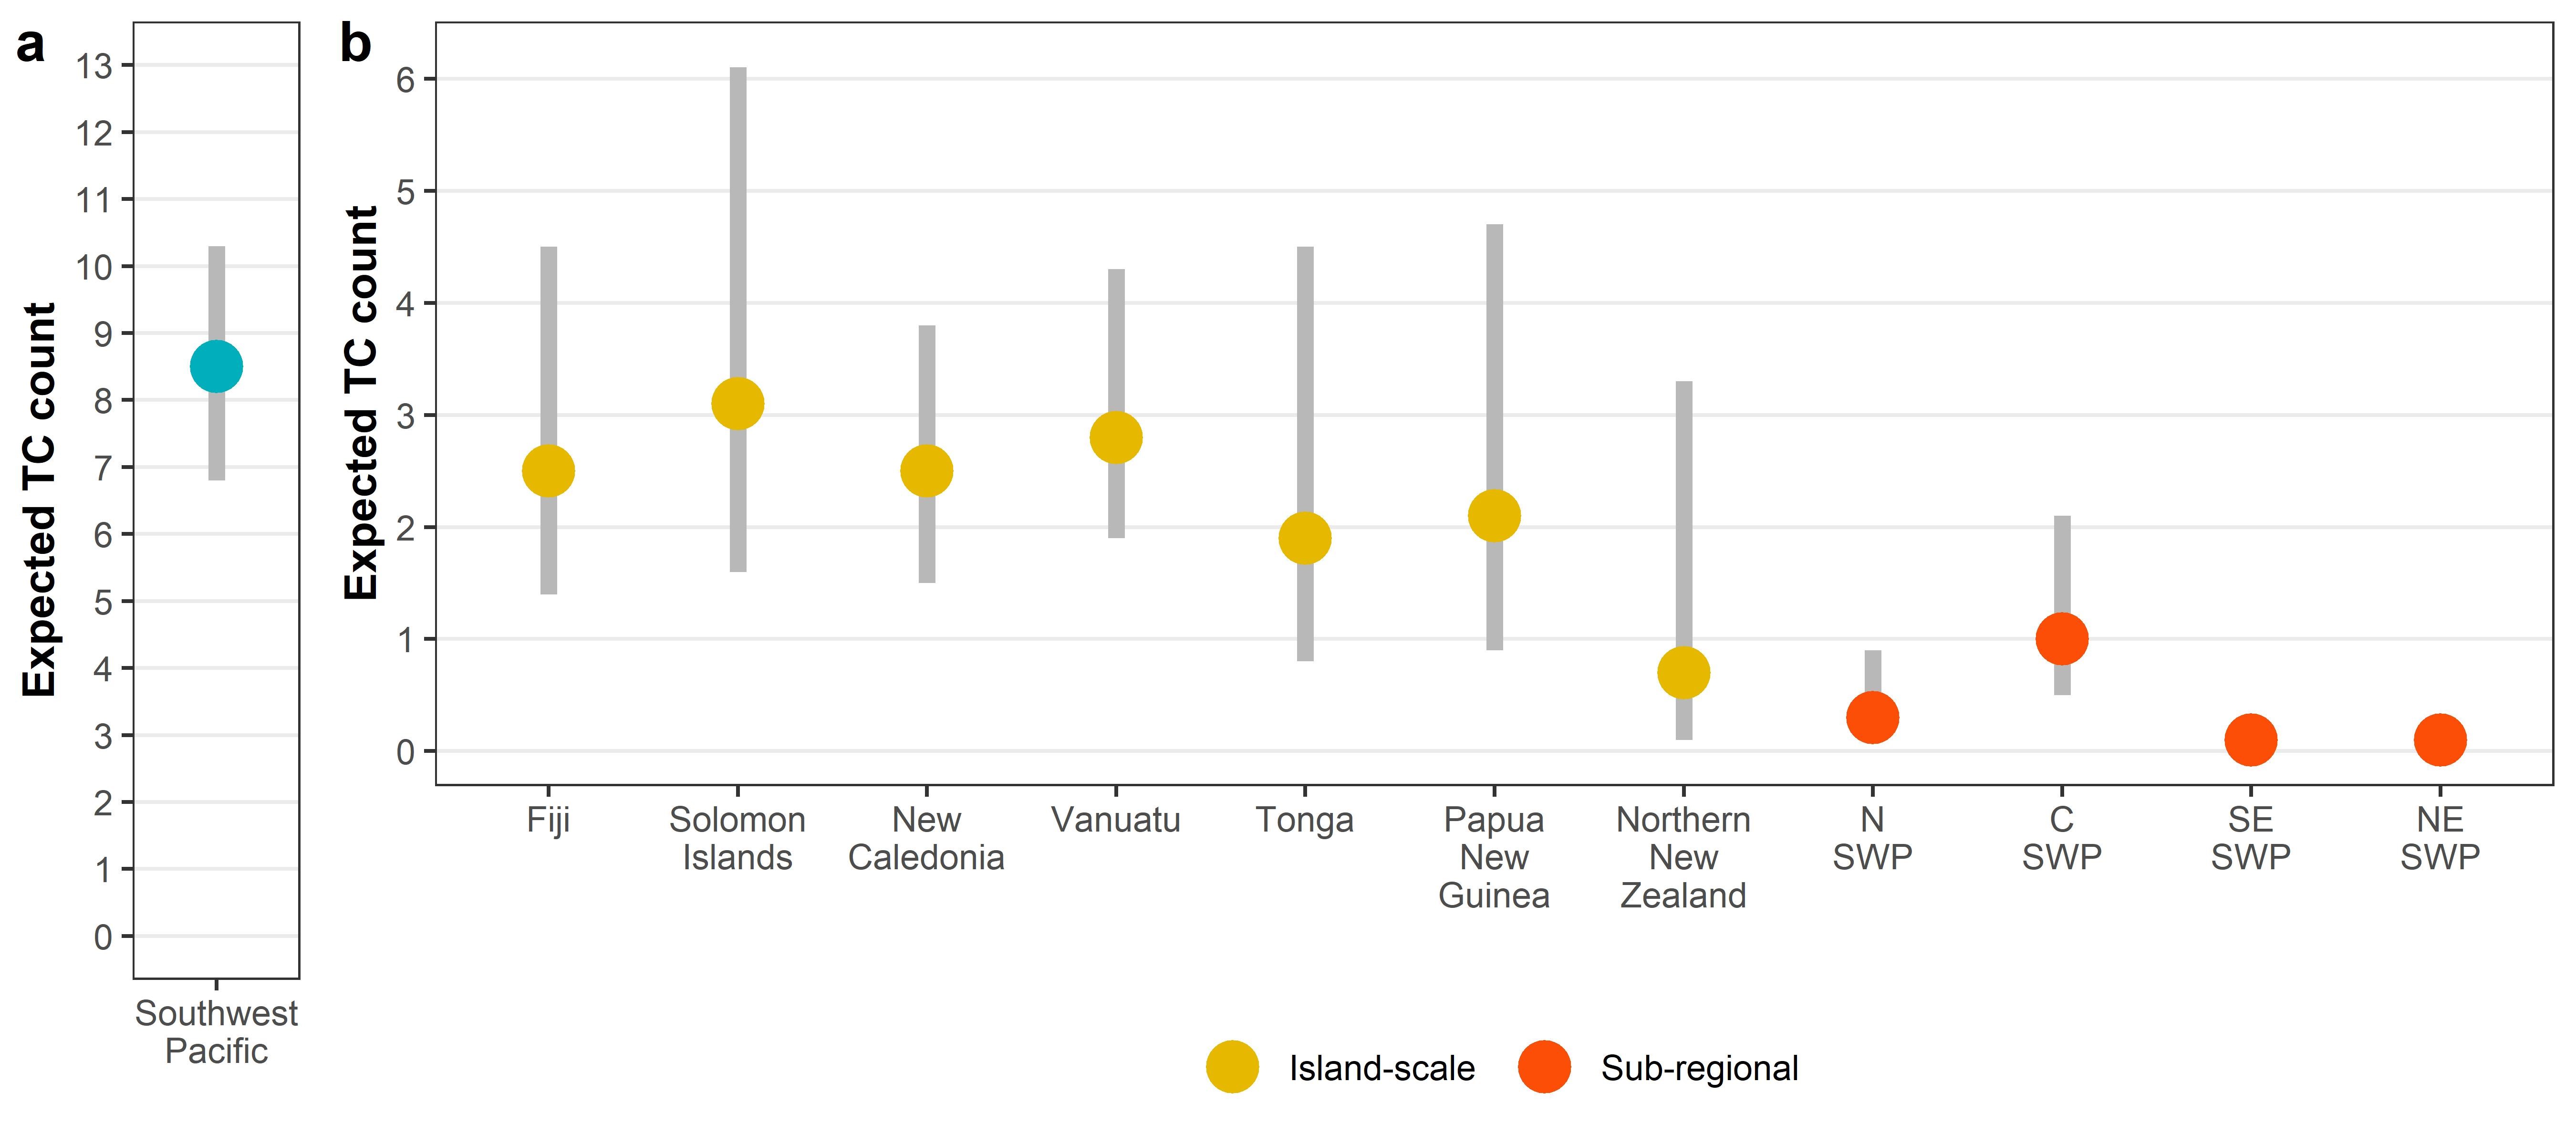
Southwest Pacific |
11.4 |
8.5 (6.8-10.3) |
▼ -2.9 |
|
|
Island Scale Models |
Fiji |
3.0 |
2.5 (1.4-4.5) |
▼ -0.5 |
|
Solomon Islands |
3.1 |
3.1 (1.6-6.1) |
► 0 |
|
|
New Caledonia |
2.9 |
2.5 (1.5-3.8) |
▼ -0.4 |
|
|
Vanuatu |
2.5 |
2.8 (1.9-4.3) |
▲ +0.3 |
|
|
Tonga |
2.0 |
1.9 (0.8-4.5) |
▼ -0.1 |
|
|
Papua New Guinea |
1.7 |
2.1 (0.9-4.7) |
▲ +0.4 |
|
|
Northern New Zealand |
0.4 |
0.7 (0.1-3.3) |
▲ +0.3 |
|
|
Subregional modelsa |
N SWP (Tuvalu, Wallis & Futuna, Tokelau) |
2.1 |
0.3 (0.1-0.9) |
▼ -1.8 |
|
C SWP (Samoa, American Samoa, Niue) |
2.7 |
1.0 (0.5-2.1) |
▼ -1.7 |
|
|
SE SWP (Southern Cook Islands, Society Islands, Austral Islands) |
2.3 |
0.1 (0.0-0.2) |
▼ -2.2 |
|
|
NE SWP (Northern Cook Islands, E Kiribati: Line Islands, Marquesas, Tuamotu Archipelago, Gambier Islands, Pitcairn Islands) |
1.6 |
0.1 (0.0-0.1) |
▼ -1.5 |
a Sub-regional models – where individual island TC climatology shows less than 1.5 TCs per season, geographically neighbouring exclusive economic zones (EEZs) have been merged to increase sample size (Click here for more information).
b Average TC counts calculated for November-April TC season.
Figure 9. Expected TC count including probable range (95% confidence intervals) for the 2020/21 Southwest Pacific Tropical Cyclone Season based on TCO-SP (Magee et al., 2020). Expected TC counts are summarised for the Southwest Pacific (panel a) and island-scale and sub-regional locations (panel b).
[1] The South Pacific convergence zone (SPCZ) is an extensive Southern Hemisphere atmospheric circulation feature that contains one of Earth’s most expansive and persistent convective cloud bands.
Download
- Southwest Pacific Tropical Cyclone Outlook (PDF 1.26 MB)
Contacts for comment
In New Zealand:
Mr. Chris Noble Manager, Severe Weather Services TCWC (Tropical Cyclone Warning Centre) Wellington MetService New Zealand Tel: +64 4 470 1175
In the Pacific Islands, please contact your local national meteorological service for information about how this guidance should be interpreted.
For Australia and associated offshore islands, please contact the Australian Bureau of Meteorology for information about how this guidance should be interpreted.
For French Polynesia, Wallis, Futuna and New Caledonia, please contact MeteoFrance regional offices for information about how this guidance should be interpreted.