Thursday 23rd April 2020
Changes in NZ air quality due to COVID-19 level 4 lockdown
Update #6 – fourth full week of level 4 restrictions.
Headlines
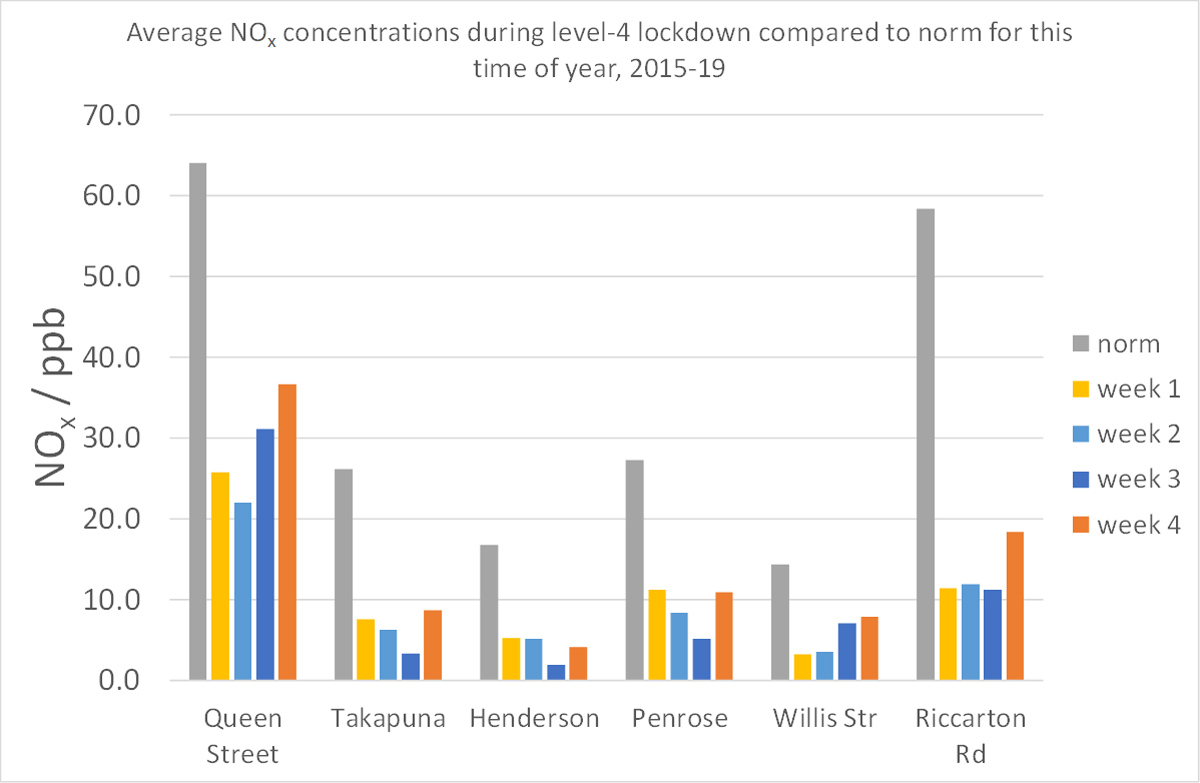
- During the whole of level-4 so far, concentrations of road traffic exhaust pollutants (nitrogen oxides) are down at near-road monitoring sites across Auckland by 55% at Queen Street, 66 % in Penrose, 75 % in Takapuna and Henderson. Reductions are 63% at Willis Street (Wellington) and 78% in Riccarton (Christchurch).
- Although concentrations of road traffic exhaust pollutants were slightly up in Auckland during week 4 (16th – 22nd April), this is most likely due to lighter winds, although possible increases in traffic volumes cannot be ruled out.
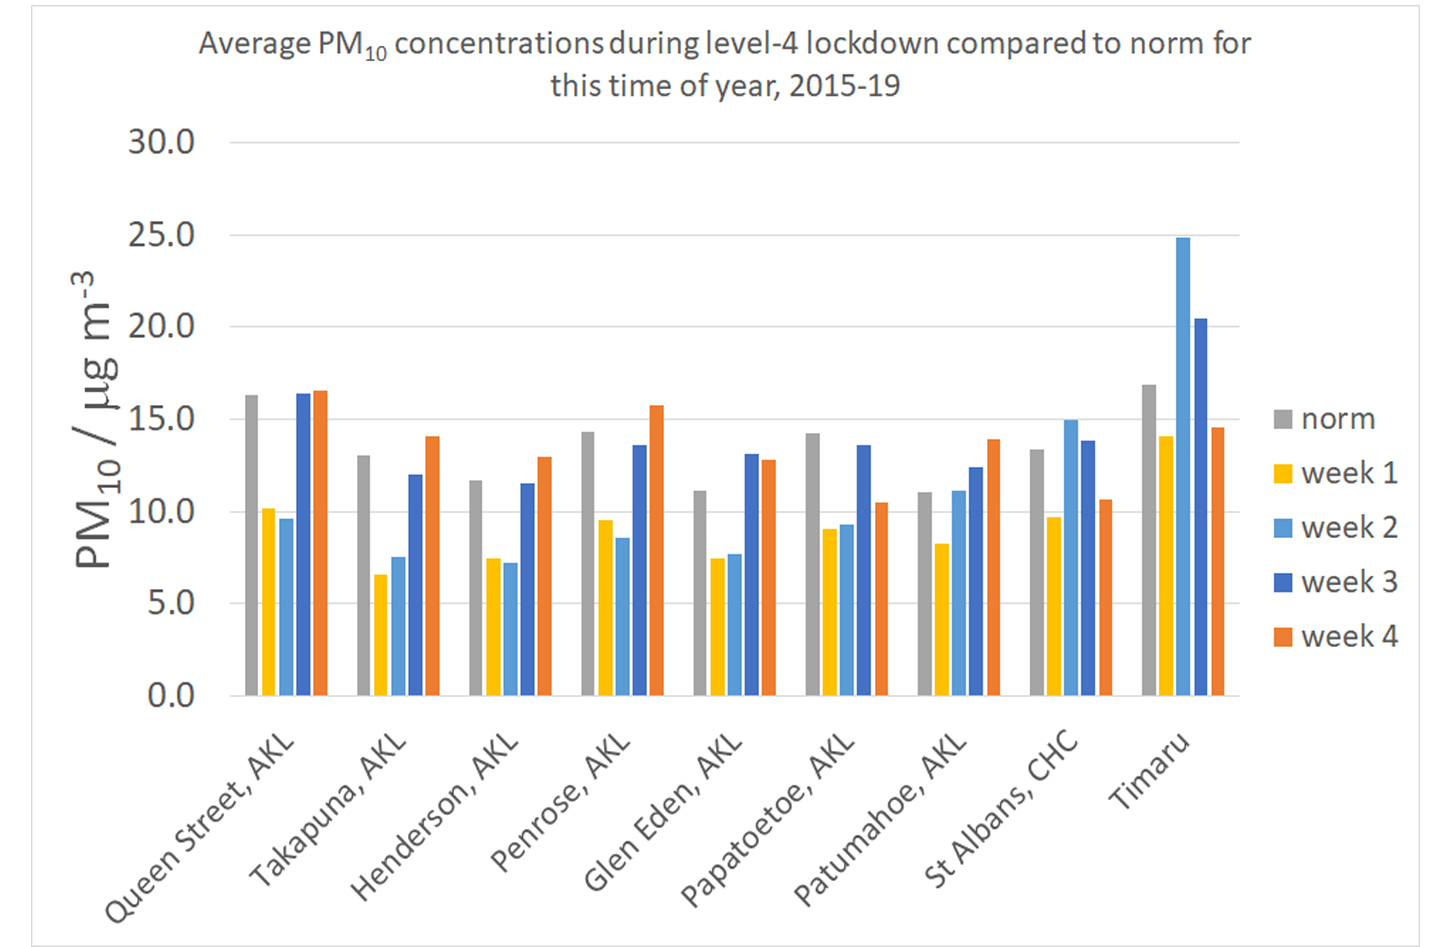
- Across the whole of level-4 so far, concentrations of airborne particulate matter (PM10) – which includes not just vehicle exhaust emissions and road dust, but other sources less likely to be reduced by the lockdown, such as sea spray and smoke from solid fuel home heating—are only marginally down across Auckland (9 – 25 % on average).
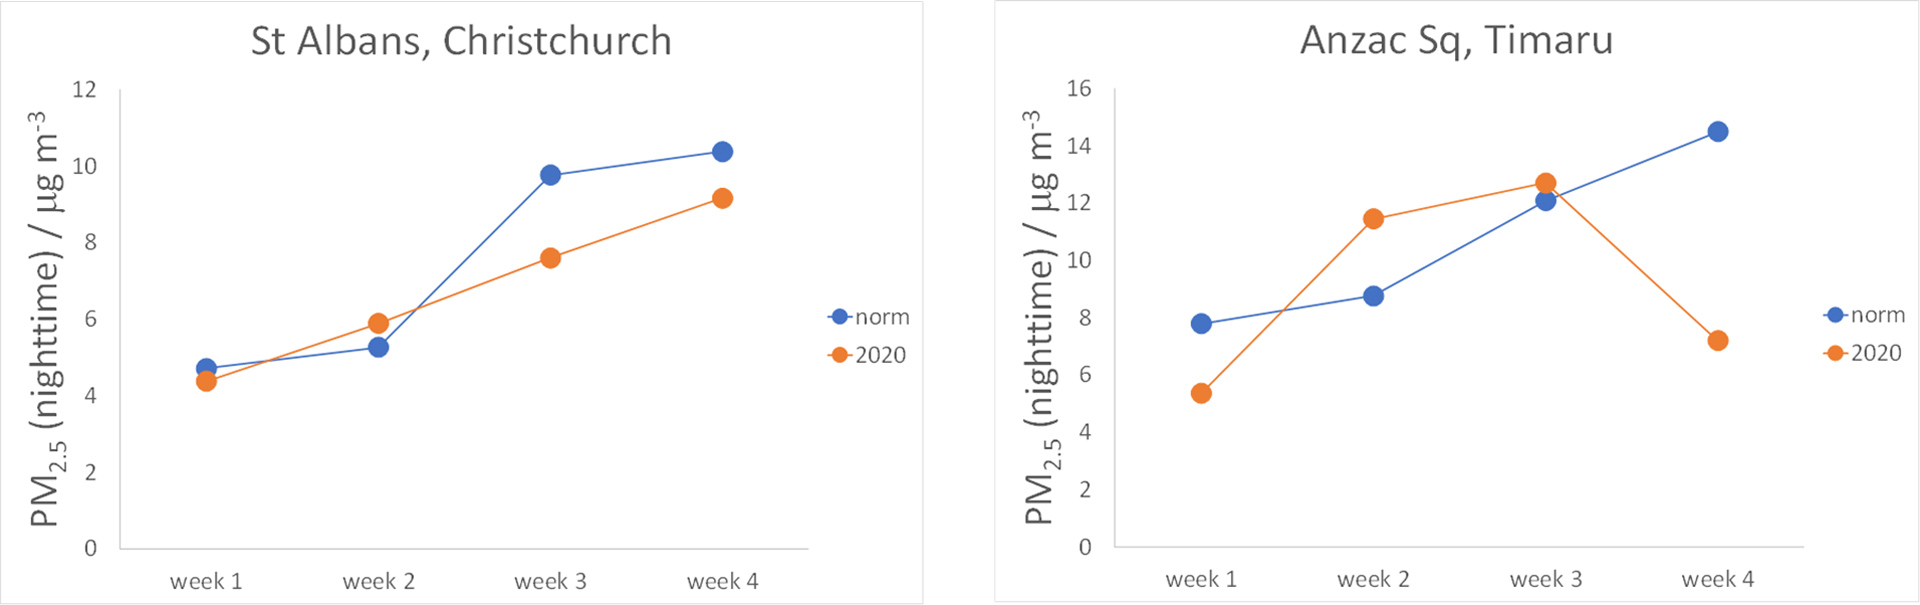
- Although there is evidence of levels of woodsmoke starting to rise in the evening in at least Timaru and Christchurch, consistent with the the expected start of the home heating season, stronger winds in Canterbury in week 4 prevented us from determining if these emissions are higher than normal due to the lockdown. We will revisit this in future updates.
Background
This is our fourth weekly update on air quality in New Zealand during the COVID-19 lockdown. The update is created by NIWA’s Principal Air Quality Scientist, Dr Ian Longley, and is based on unverified data provided by Auckland Council, Environment Canterbury and Greater Wellington Regional Council. Updates are not intended to provide comprehensive national coverage, but rather focus on emerging themes at indicative locations.
N.B. “Unverified” means that the data has yet to go through the Council’s quality control process. This means a small error might be present. Verified data is usually available a few months after the original data was recorded. Lockdown conditions may introduce additional delays in verification of the data presented here.
What are our findings for week 4?
1. Nitrogen oxides (mainly traffic exhaust pollutants)
Figure 1 shows how concentrations of NOx have fluctuated between weeks at four sites in Auckland and one each in Wellington and Christchurch. Our week 1 update showed large variations in NOx from day to day due variations in the weather, especially wind speed. NOx concentrations were slightly up in week 4 probably due also to lighter winds.
Now that four weeks of data is available, the impact of these meteorological variations can be smoothed out by averaging all data, giving us a more robust measure of the change in emissions. Table 1 shows the average reduction in NOx across all four weeks.
Table 1: Changes in week-average NOx concentrations compared to the norm for this time of year (based on 2015-2019).
|
Week 1 - 4 combined |
|
|
Queen Street, AKL |
-55 % |
|
Henderson, AKL |
-75 % |
|
Takapuna, AKL |
-75 % |
|
Penrose, AKL |
-66 % |
|
Willis Str, WTN |
-63 % |
|
Riccarton Rd, CHC |
-78 % |
Commentary
The reductions for the non-downtown sites are similar to the reductions in traffic volumes on representative state highways reported by the NZTA (up to 17th April). The slightly smaller reductions at the downtown sites of Queen Street and Willis Street are probably related to smaller reductions in traffic, especially buses, although this data is not yet available.
Whereas such reductions in traffic pollution have occurred in the past for brief periods – particularly on some public holidays, or during storms – such an extended period of improved air quality is unprecedented. The apparently strong correlation of reductions in NOx with reductions in traffic volumes confirms that other potential sources – particularly industry – are minor relative to road traffic emissions. We can therefore expect that NOx concentrations during level-3 and beyond will also reflect any re-growth in traffic. Whether or not NOx levels return to normal will depend on whether our driving patterns return to normal or whether increased working from home, new social distancing norms and increased unemployment keeps traffic below recent pre-lockdown levels. Any acceleration of the transition to electric vehicles or public or active transport may also prevent air pollution returning to pre-lockdown levels.
2. Particulate matter (traffic, heating, industrial and natural sources) in Auckland
Figure 2 shows how concentrations of PM10 have fluctuated each week at 7 sites in Auckland and two in Canterbury. As with NOx this is largely due to variations in the weather, especially wind speed. Large reductions in week 1 have not been repeated since, with PM10 concentrations rising above normal in week 4 at 6 out of 7 Auckland sites. However, in Canterbury, week 4 concentrations are down. This probably reflects lighter winds in Auckland but stronger winds in Canterbury during week 4.
Now that four weeks of data is available, the impact of these meteorological variations can be smoothed out by averaging all data, giving us a more robust measure of the impact of any change in emissions. Table 2 shows the average reduction in PM10 across all four weeks.
Table 2: Changes in week-average PM10 concentrations compared to the norm for this time of year (based on 2015-2019).
|
Week 1 - 4 combined |
|
|
Queen Street, AKL |
-19 % |
|
Henderson, AKL |
-17 % |
|
Takapuna, AKL |
-24 % |
|
Penrose, AKL |
-18 % |
|
Glen Eden, AKL |
-9 % |
|
Papatoetoe, AKL |
-25 % |
|
Patumahoe, AKL |
+3 % |
|
St Albans, CHC |
-8 % |
|
Anzac Sq, Timaru |
+13 % |
Commentary
Reductions in PM10 across Auckland range from 9 to 25 %. Over a 4-week period PM10 concentrations in Auckland can naturally vary by 10 – 15 % above or below the historic norm. This makes it difficult to determine the degree to which the reductions have been caused by the lockdown.
The smaller reductions, compared to NOx, are due to the fact that many emissions sources other than traffic emit particles and contribute to PM10 levels in the air. In Auckland during autumn the most significant source is sea salt which is left in the air after sea spray evaporates. Samples of particulates have been analysed by GNS Science over many years showing that, at this time of year, sea salt contributes around 5 mg m-3, or a third to a half of all PM10, and this will not be affected by the lockdown. The same analyses have shown that road traffic probably contributes only a third of PM10 at the most impacted site (Queen Street), a sixth at less impacted sites (like Lincoln Road, Henderson) and even less at low-traffic suburban sites. In fact, the average reductions in PM10 across Auckland during lockdown are entirely consistent with the traffic component reducing by 75 % (as indicated by changes in NOx) whilst other contributing sources remain largely unchanged.
It is at this time of year that smoke from biomass burning (mainly home heating using wood or coal) usually starts to impact air quality. The effect is relatively modest in Auckland where this smoke is largely responsible for PM10 rising by a third between April and June before falling back in the spring. In towns and cities which are colder, rely more on wood and coal and have less traffic the effect is more dramatic. In Timaru, for instance, woodsmoke can cause PM10 to double between April and June. Woodsmoke dominates PM10 through most of South Island and inland North Island from May to July. This year, with more people at home for longer, there are good reasons to expect higher home heating emissions than normal.
At present, there is no clear evidence that rising levels of home heating are impacting PM10 levels, when averaged over a week. However, monitors in Timaru and St Albans in Christchurch which also monitor PM2.5 - a subset of PM10 which focusses on the smaller combustion-related particles and partially excludes dust and sea salt - are clearly starting to report strong rises in levels during the evening. It is currently too early to establish whether the lockdown is causing PM2.5 to rise faster than normal because this is even more sensitive to variations in the weather than traffic pollution. In general, the “true” level of emissions is only revealed when the wind drops in the evening and week 4 of lockdown experienced higher winds than usual in Canterbury. However, the situation should become clearer over the next few weeks.
Future topics planned for these updates:
- How do the results compare to findings overseas?
- Significance of the changes in air quality for health
- Air quality in our homes
- Impact of move to level-3.
Technical notes
We’re comparing air quality now with ‘normal’, but how do we define ‘normal’?
As well as fluctuating daily, air quality changes on a seasonal basis, being generally worse in winter and better in summer. However, for most pollutants, the long-term trend is very slow so that concentrations have changed relatively little from year to year over the past 5 years. To account for these effects, this analysis compares hourly data from level-4 lockdown with average air quality in the same weeks (14 to 17), and one week either side, for the previous 5 years, which we take to represent ‘normal’ air quality at each site (unless there is evidence of a significant change in the ‘normal’ in the 5 years preceding the lockdown).
What pollutants does the analysis focus on
This analysis updates our previous report on concentrations of oxides of nitrogen (NOx). NOx consists of two pollutants (nitric oxide and nitrogen dioxide). They are known to exacerbate asthma, stunt childhood lunge development and are linked to numerous other health impacts for the young and vulnerable. In our cities road traffic exhaust is overwhelmingly the main source, especially diesel vehicles, and so NOx can also be used to indicate levels of all traffic exhaust pollutants.
This analysis is also our first to look at levels of particulate matter (PM). As well as traffic exhaust, PM also comes from road dust, natural sources like sea salt, and (during winter) smoke from the burning of wood and coal especially for home heating. PM10 (particles smaller than 10 microns and likely to be inhaled deep into the lungs) is monitored at more than 50 sites across the country. Levels in some towns, mostly in South Island, can breech National Environmental Standards on cold winter days.
Figures