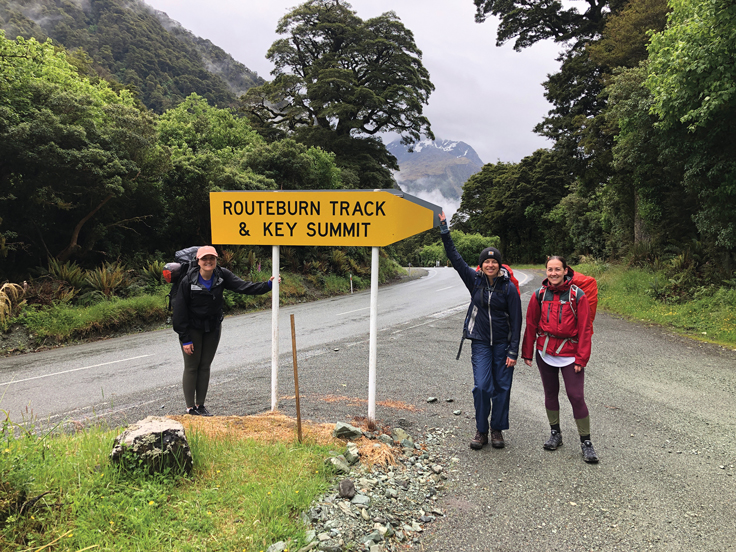
For about a week before walking Fiordland’s Routeburn Track at New Year, Nava Fedaeff was constantly checking and rechecking the weather forecast.
With three days ahead without cell phone reception, this was very much standard tramping preparation. However, the forecast Fedaeff was checking was far from standard – at that stage, it was not even available to the public.
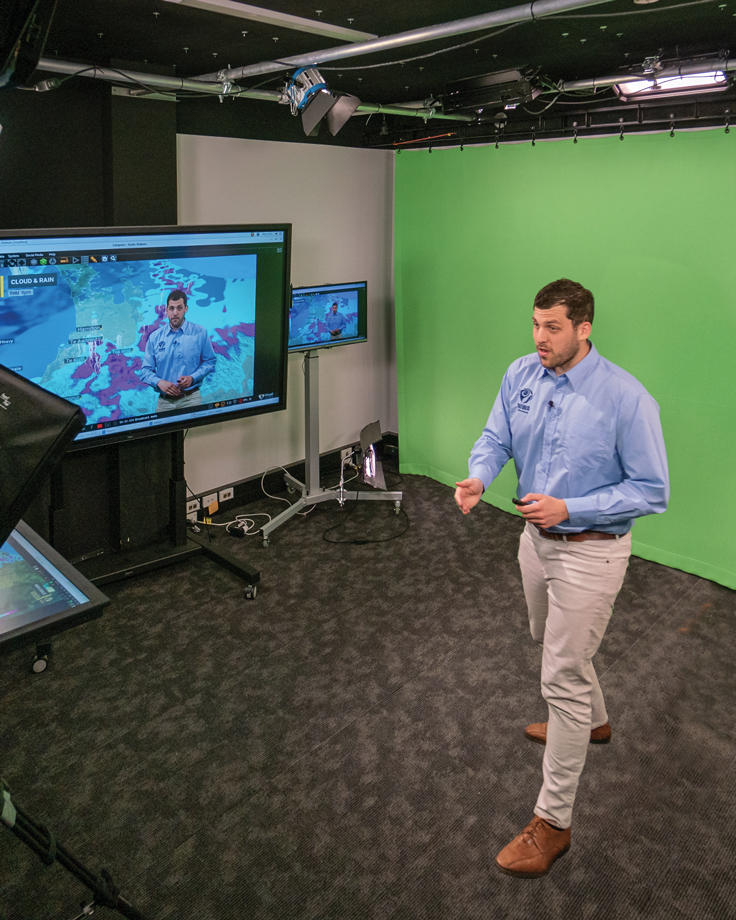
It sat in a test space in the back end of NIWA’s website, accessible only to the small team working on it. Fedaeff is a NIWA forecaster and one of the projects occupying her time over summer was compiling the new “Parks Weather” function on the NIWA Weather website.
Parks Weather is the result of a collaboration with the Department of Conservation (DOC) to provide better weather information for people venturing into New Zealand’s rugged, remote and ever-changing great outdoors.
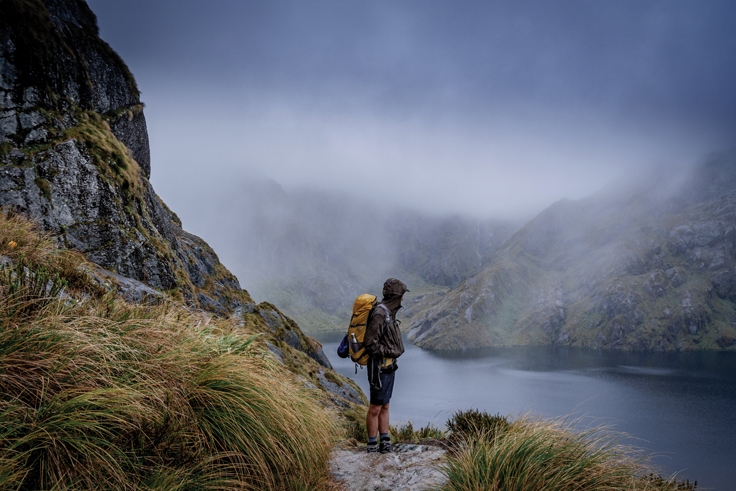
In many ways, Fedaeff is the perfect fit for the project. A keen tramper and user of New Zealand’s conservation spaces, she is also a weather scientist with advanced skills in data visualisation.
Having inherited artistic talent from her parents, she has an innate ability to turn her detailed understanding of how weather works across this country’s varied terrain into smart visual information that is easy for people to use.
That early “test” forecast for the Routeburn Track at New Year was spot on.
“I knew there was going to be rain, and that it might be bad, but I didn’t think it would be far enough west to affect us,” Fedaeff says.
She was right. The forecast was correct. The rain caused flooding in Otago, but the Routeburn stayed mostly dry.
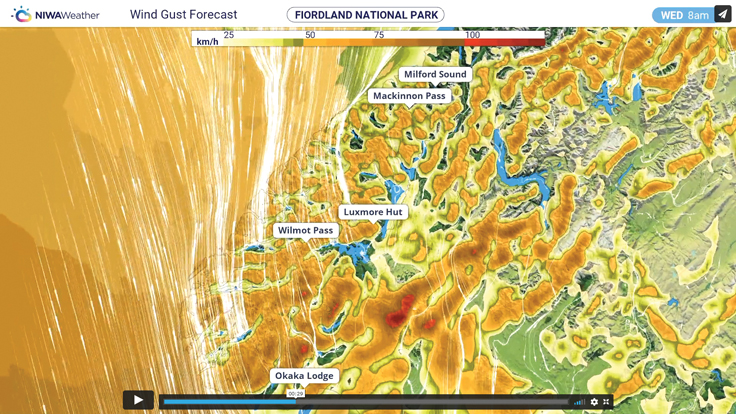
Testing is now well and truly over and the Parks Weather forecast site has been operational for several months. Driven by NIWA’s extensive forecast data, it provides a daily national weather hazard overview video, presented by a NIWA forecaster. It also features tailored, detailed forecasts for all 13 national parks and about 50 huts or specific locations.
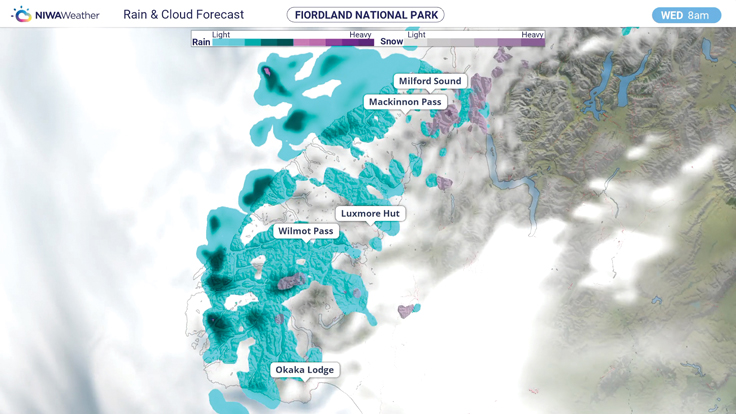
For instance, click on Arthur’s Pass National Park and you can view a video showing the topography and weather for the next six days, as well as NIWA’s unique flow forecast, which uses data visualisation tools to depict changes in river flow and levels.
Click again and you will see separate six-day forecasts for Carroll Hut, Avalanche Peak and Carrington Hut. Each location has its own predictions for rain, snow, average wind speed, wind gusts, wind chill, temperature, visibility, freezing level and relative humidity.
Particular hazards such as heavy rain, low temperatures, strong winds, and more are highlighted in yellow, orange, or red, depending on their chance of occurrence. Users can also click through to the DOC website for more information on planning their trip and print a summary of the forecast to take with them.
“We’ve really thought about how people might navigate the website and use the information. People heading outdoors are more exposed and more at risk, so we’ve brought hazards to the forefront of how we’re communicating,” Fedaeff says.
She says the site is firmly focused on the user.
“Improving public safety is at the heart of the design. We put a lot of effort into how to make those messages more prominent. We want people to know what it actually means when we forecast wind gusts of 90km/h.
“If we can get people to read the forecast, they will know what decisions they need to make when planning their trip.”
The Parks Weather forecasts are the end result of a complex process that requires taking streams and streams of weather information gathered from NIWA’s vast environmental monitoring network, applying new data science techniques, some behind-the-scenes weighting and model bias correction, and then customising it with a specific client in mind.
While it may look like a new step in bespoke weather forecasting, it is something NIWA has been working towards for some time.
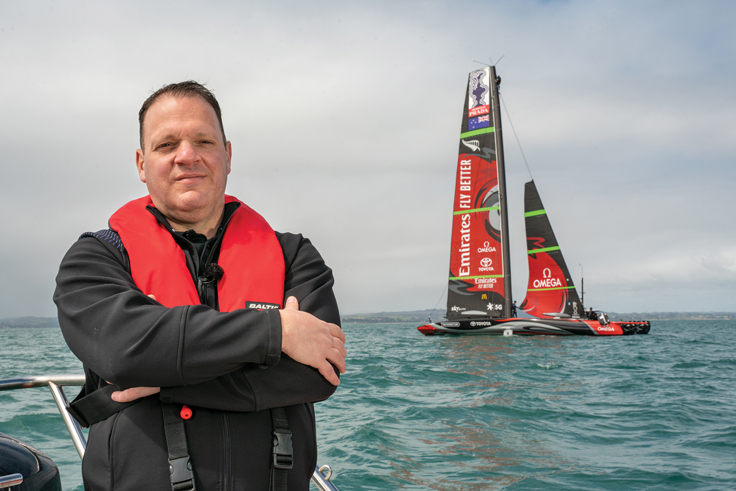
It was a busy summer for the NIWA Forecasting Services team. At the same time as development on the Parks Weather site advanced, the team was also providing a carefully tailored package of ultra-high-resolution weather and current data to Emirates Team New Zealand for its ultimately successful defence of the America’s Cup.
NIWA joined the campaign back in May 2019 as the official supplier of weather and marine information, and the forecast team spent the next 19 months supplying tightly focused information through the key design and race phases.
This entailed analysing potential conditions on the Hauraki Gulf racecourse – above and below the waterline – in minute detail, examining how winds chopped and changed around its islands and coastlines, how waves were likely to respond, and the interplay between ocean currents and tides.
These observations were combined with detailed forecasting technology developed in-house and run through the Cray supercomputers in NIWA’s High-Performance Computing Facility.
This processing power allowed the NIWA team to forecast Gulf conditions down to a resolution of just 333 metres. Traditional weather forecasting relies on modelling based at a 1.5km resolution, making the America’s Cup forecasts about five times more detailed than normal.
Emirates Team New Zealand were able to incorporate this unprecedented level of environmental information into their detailed boat design and testing phases, as well as their successful race day strategies.
To quote Emirates Team New Zealand meteorologist Roger “Clouds” Badham: “No matter how good a forecaster you are, you are only as good as the models you rely on.”
his evolution of high-resolution environmental modelling and forecasting has been powered by developments in data science and the capacity of supercomputers to process phenomenal amounts of information. NIWA’s Cray machines can perform more than two thousand trillion calculations per second.
One of the goals now within range is to make weather forecasts accurate for up to six weeks at a time – the period defined by Principal Scientist Chris Brandolino as the “sub-seasonal space”. Where today’s weather forecasts are accurate for about five to seven days ahead, tomorrow’s are likely to have some level of predictability for two to six weeks.
“This is where there will be tremendous gains over the next 5 to 15 years. The capabilities to forecast one month or three months out will be underpinned by improved models as well as machine and deep learning techniques,” says Brandolino.
Expect, too, to hear a lot more about ensemble modelling.
“We are now on the precipice of operationalising our ensemble model, which will enable us to communicate uncertainty a lot more accurately,” Brandolino continues.
If that sounds like a glaring contradiction, read on. Ensemble modelling is about running simultaneous instances of a forecast model through the supercomputers, each with some details slightly rearranged.
Out the other end comes a range of possible forecast scenarios that are then analysed to determine which are most likely to occur. The models then estimate the chance of reaching or exceeding certain thresholds, such as rainfall exceeding 100mm.
Brandolino describes ensemble modelling as “leveraging the wisdom of the crowd”.
“When you are predicting the future state of the atmosphere, you have to know the current state. With ensemble modelling we can say ‘What if the atmosphere is in this state or that state?’ and use different starting points.”
NIWA’s ensemble model – the only one of its kind in New Zealand – has 18 members and therefore 18 potential starting points. A forecaster can slice and dice the results by asking, for example, how many of the 18 members are predicting 100mm of rain on Thursday. If 12 come to the same conclusion, it offers a forecast with a high degree of certainty. If there’s only two or three, confidence is lower.
“This enables me to better understand the range of outcomes,” says Brandolino. “And I can then communicate uncertainty more easily. You’re not putting all your eggs in one basket.”
Ensemble modelling is already coming into its own on the Parks Weather site, used to articulate the chance of a particular weather hazard occurring.
NIWA’s Seasonal Climate Outlook (SCO) will also benefit. These are issued at the beginning of every month and offer expectations on the most likely weather patterns over the next three months, as determined by NIWA’s forecasters and hydrologists.
NIWA has been producing them since 1999 and they are among the most accessed items on its website. Farmers, horticulturalists and others in the primary sector are among the biggest users.
Forecaster Ben Noll, who regularly compiles the SCO, says the goal is always to improve their accuracy and usefulness. This can be done by improving the models that drive the outlook, refining communication techniques such as focusing on impacts and working more closely with end-users.
It’s especially important on the heels of back-to-back drought events.
Noll is hopeful NIWA may soon publicly issue its one-month outlook. So far, it has been a product reserved for specific clients. Now, with new and improved models and data-driven machine and deep learning techniques, strides are being made in sub-seasonal forecast skills.
One of the techniques used to improve the resolution and usefulness of climate models over New Zealand is called “statistical downscaling” – taking global models with a 25 to 50km resolution over New Zealand, down to 5km to more accurately resolve Aotearoa’s complex terrain.
Current machine learning experiments underway include looking at 35-day rainfall forecasts by leveraging an upgraded forecast model launched by the National Oceanic and Atmospheric Administration in the United States.
While Brandolino is understandably excited by the potential of data science techniques to improve forecasting, he recognises that it also requires a huge shift in thinking that people will need to make.
“It seems to me that as this area improves people will need to think about the best way to use the information. If I tell people that in three months’ time there will be a bad cold snap for 10 days, they are likely to respond that there’s a lot of time between now and then.
“We don’t have that capability right now, so people are not sure how to leverage and use this information. So, it’s not just developing the capability, but it is also about engaging with end-users to maximise this new frontier.”
Noll says producing actionable forecasts out to three months has long been a challenge, but is hopeful advancements in sub-seasonal prediction will help to bridge the gap between weather and climate.
That’s the challenge facing forecasters as they develop the capability to provide highly specific forecasts for any business, organisation or individual whose success in some way relies on certain climatic conditions.
Farming and the energy sector are obvious examples, but rain or shine also affects the number of people attending a large event, while the type of weather can influence sales and product choices. Knowing when and what the weather will do means better planning and potentially better outcomes.
Meanwhile, Fedaeff is expanding NIWA’s work with the Department of Conservation. There has been ongoing work with DOC Visitor Centres, learning how rangers operate in the back country and what weather services they need.
There are also other tweaks, such as an automated email to warn companies operating on the Tongariro Alpine Crossing of bad weather.
“I’ve always been excited about this project because I’ve been to a lot of these places and I’m a forecaster, so I know what information is out there. It’s made it more rewarding to build something I would use myself.
“This is the first step – there is so much more we want to do.”
The perfect storm for modellers
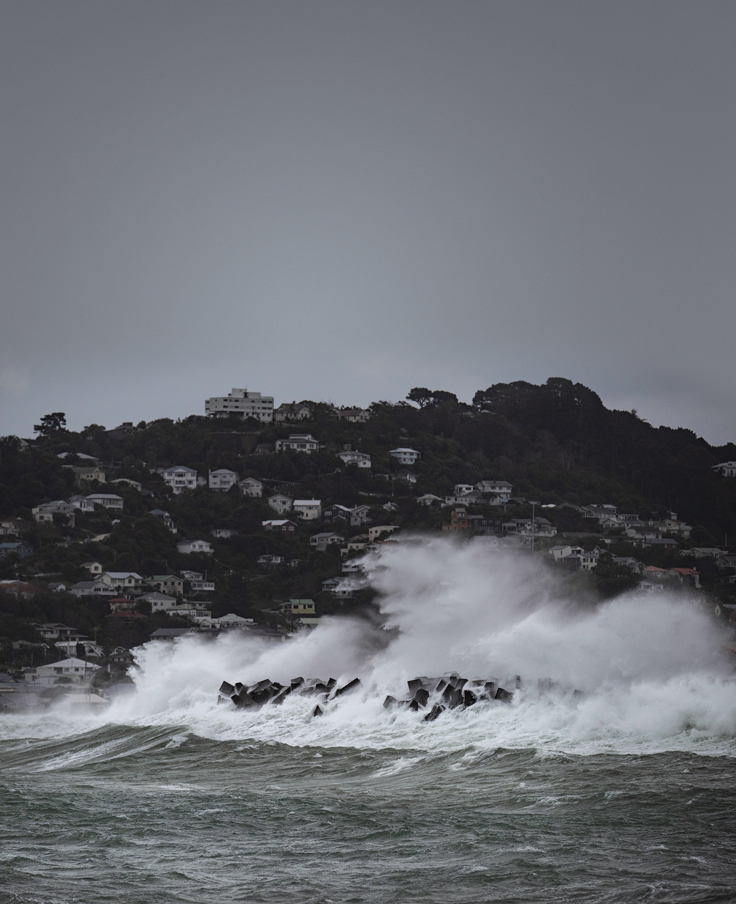
Occasionally, the science of forecasting and serendipity coincide in a way that demands some immediate action. At the end of June, NIWA forecaster, Chris Brandolino, spotted huge waves heading for Wellington’s south coast.
Brandolino called his coastal modeller colleague, Dr Christo Rautenbach, who along with NIWA hydrodynamic modeller, Dr Cyprien Bosserelle, had been doing some in-depth work on the capital’s south coast for Wellington City Council.
The work had involved reconfiguring an international model that enabled local coastal simulations to be run faster and cover bigger areas at much higher resolution. The pair investigated six previously large storms hitting the Wellington coast, scouring news reports for information on coastal inundation.
When they looked at the projected offshore waves, they realised the forecast wave direction and height was incredibly similar to the waves recorded during a 1992 storm. They worked into the night of 28 June, using the model and latest forecasts to urgently assess how people and property might be affected.
With the results showing substantial risk, Dr Andrew Tait, NIWA Chief Scientist Climate, contacted the Wellington Region Emergency Management Office, and the team was immediately brought into emergency preparedness meetings alongside other agencies such as the council, MetService, and Fire and Emergency New Zealand.
On 29 June the latest information was showing the biggest risk to be to a portion of Breaker Bay Road, contributing to a decision to evacuate residents.
While the waves did not result in the worst-case scenario this time around, Dr Rautenbach is very happy with the accuracy of the model’s predictions.
“In our model, there is always a choice between one option and a more conservative option – we always choose the conservative one.”
Evaluation of the model is ongoing and likely to provide further insight into how it can be improved. It is now being used in the Bay of Plenty, and there are plans to make it available to other areas.
“This experience has shown us that this is potentially a valuable tool that can be developed further for bespoke purposes. I’m super happy with the outcomes, given how we were able to produce a high-resolution prediction at the eleventh hour,” Dr Rautenbach said.
Check out the NIWA Parks Weather website.
This story forms part of Water and Atmosphere - August 2021, read more stories from this series.