Southwest Pacific Tropical Cyclone Outlook: Average or below average activity for most islands during the late season, but near normal number of total named storms for the region.
New Zealand's National Institute of Water & Atmospheric Research (NIWA) and New Zealand MetService have issued a tropical cyclone outlook on behalf of collaborating organisations from the southwest Pacific, including Australia, the USA, the Pacific Island National Meteorological Services, French Polynesia, and New Caledonia.
Climate and weather forecasting organisations across the Pacific are predicting near normal tropical cyclone numbers for the 2011 – 12 season as a whole. On average, ten named tropical cyclones occur in the southwest Pacific (between 135°E and 120°W) each season (November – April). The TC forecast update indicates that a total of 6 – 8 named cyclones are expected for the late season (February – April). Two named storms have occurred since the start of the season in November 2011 through the end of January 2012 (TC Fina and TC Grant). As such, the November–April seasonal total is likely to be in the range of 8 – 10 named storms. A small area of higher than normal activity is expected to be focused well south of the Southern Cook Islands and Austral Islands. For most island groups, TC activity is expected to be normal or below normal for the remainder of the season.
Despite normal or below normal activity, most countries west of the International Date Line, including Papua New Guinea, the Solomon Islands, Vanuatu, New Caledonia, and New Zealand (from ex–tropical cyclones) are likely to experience an interaction or two with a tropical cyclone because of La Niña that is currently in place. It should be recognised that the expectation of activity (and associated risk) ascribed for each island group is subjective, but these expectations are based on the style of La Niña that exists at present, along with international climate forecast centres that indicate the high likelihood of La Niña diminishing from mid-autumn. Note that the forecast of normal or below normal activity for islands like New Caledonia, Vanuatu, Fiji, and Tonga indicates two or three tropical cyclones can still be expected during the season as a whole. In addition, most of the tropics and sub–tropics can be severely affected by at least one tropical cyclone during the remainder of the season, and as such all nations should remain vigilant.
Outlook in more detail
La Niña conditions exist at present, and sea surface temperature anomalies across the central and eastern Equatorial Pacific Ocean are negative relative to normal. More frequent high pressure anomalies have occurred over French Polynesia during late austral spring and through mid-summer, with lower pressures over eastern Australia. The style of La Niña that has developed is moderately coupled between the ocean and atmosphere, and the South Pacific Convergence Zone has been displaced south and west of normal during the past four months. The oceanic component of ENSO is expected to weaken over the coming months, and as such the style of the current La Niña is anticipated to degrade into an atmospheric-dominated event from mid-autumn. Past situations that describe a similar scenario (analogues) indicate that normal or below normal tropical cyclone (TC) activity is likely for most islands in the southwest Pacific during the remainder of the TC season, with slightly elevated activity well to the south of the Southern Cook Islands and Austral Islands from an extra-tropical storm. Although some reduced activity is indicated to the west of the International Date Line during this time, all communities should remain alert and prepared.
TC forecast suggests average overall numbers of 8 – 10 named TCs for the southwest Pacific basin can be expected by the end of April 2012. On average, ten named tropical cyclones occur each year for the southwest Pacific region. Southwest Pacific TCs are grouped into classes ranging from 1 to 5, with 5 being the most dangerous. For the coming season, at least one cyclone is forecast to reach at least Category 3, with mean wind speeds of at least 64 knots or 118 km/h and one system may reach at least Category 4 strength, with mean wind speeds of at least 86 knots or 159 km/h.
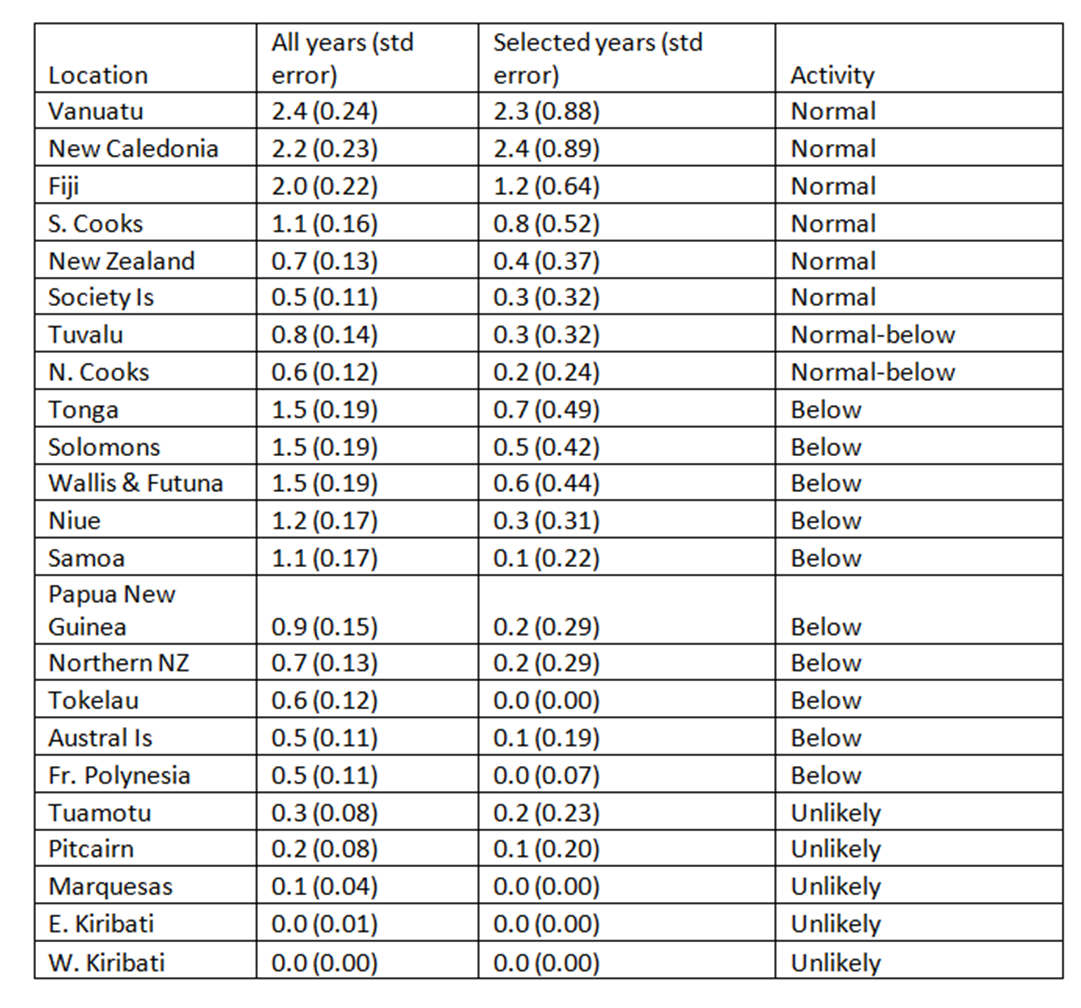
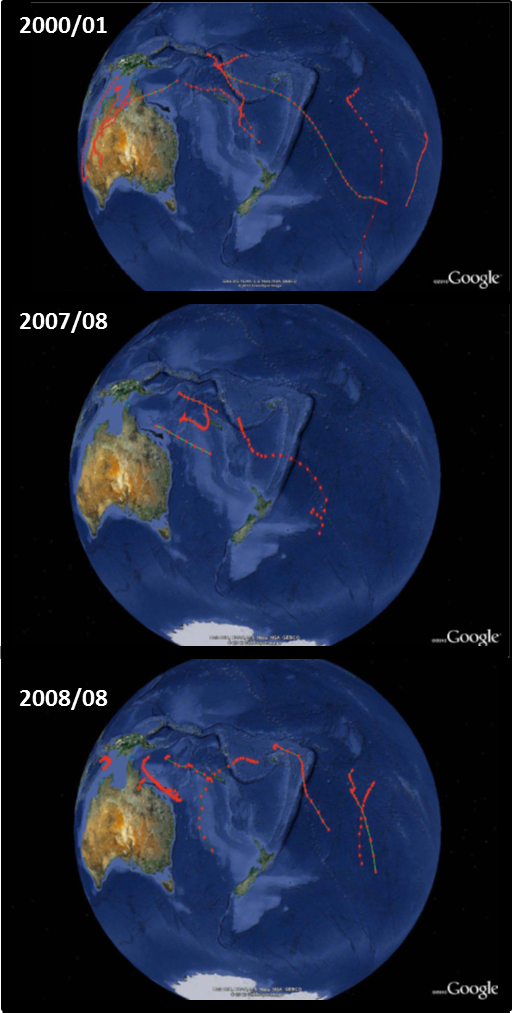
Each year, tropical cyclones have a significant impact on the southwest Pacific. Places like Vanuatu and New Caledonia typically experience the greatest activity in the region, with an average of about 3 or 4 TCs passing close to those countries each year. The past years selected as being similar to this season are 2000/01, 07/08 and 08/09. New Zealand usually experiences more frequent ex-tropical cyclone interactions during La Niñas, and is also vulnerable to a close TC passage during seasons where the Southern Oscillation Index is low or neutral. However in only one of these selected years did an ex-tropical cyclone come close to the country. While TC activity is generally reduced for islands to the east of the International Date Line during La Niñas, historical cyclone tracks (see Figure 2) indicate that TCs can affect parts of southwest French Polynesia, including the Society and Austral Islands, and the southern Cook Islands during La Niñas, especially late in the season. All islands should remain vigilant as the current La Niña continues to evolve with progression into Austral summer. During moderate La Niñas with a strong atmospheric component (strong SOI) but slightly weaker equatorial SST anomalies(see explanation of analogue selection below), ex-tropical cyclones are known for transitioning into the mid-latitudes within ±15° of the Dateline and they typically have a strong southeasterly or southerly slant to their trajectory.
Additional background information
In the Southwest Pacific, tropical cyclones (TCs) usually develop in the wet season, from November through to April, but occasionally occur in October and May, and have even occurred in June.
Peak cyclone occurrence is usually from January to March. In seasons with similar background climate conditions to present, several tropical cyclones occur over the Gulf of Carpentaria as well as in the Coral Sea region between the Solomon Islands and New Caledonia, and near Vanuatu, Fiji and Tonga, while a few affect other areas. On average, nearly 80% of the tropical storms that have developed since the 1969-70 season have reached Tropical Cyclone force with mean wind speeds of at least 34 knots (63 km/h).
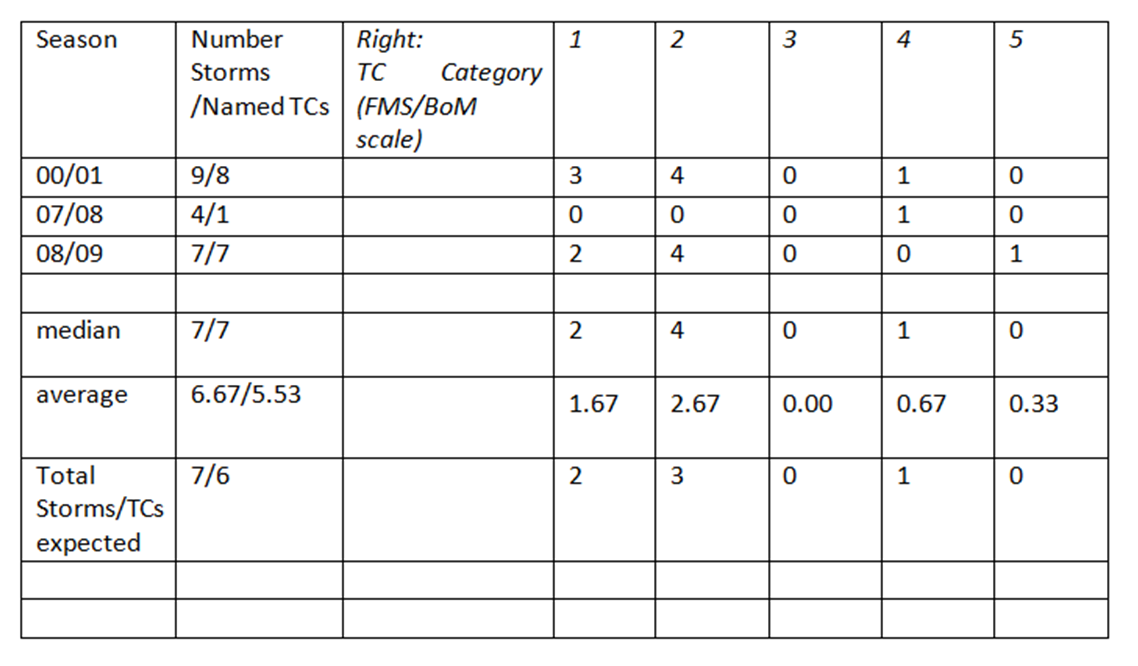
We used a joint ENSO index that combines the atmospheric index (SOI) with the most widely-used oceanic index (NINO3.4), described in Gergis and Fowler (2005) as the "Coupled ENSO Index" (CEI), to identify possible analogues for TC activity in the 2010-11 late season. Past analogues to describe the current climate state (re-development of La Niña through spring and into summer) ahead of the late TC season were assessed. Winter (JJA), spring (SON), and early summer (December) conditions were examined for the tropical Pacific for 1969 to Present. For the past late winter, the atmosphere signalled the existence of a La Niña, but the ocean was still in a neutral state. This was followed by strengthening of SST anomalies in NINO3.4, whereby the redevelopment of La Niña showed coupling between the ocean and atmosphere. Using the CEI, we then highlighted years when the equatorial SSTs were neutral but the atmosphere was La Niña-like, followed by springtime conditions when the atmospheric signals were in synch with the ocean (i.e. what Gergis & Fowler term a well coupled or "NINA-style" La Niña). This highlighted three analogue tropical cyclone seasons (2000/01; 2007/08; 2008/09) for February-April. Note that the small number of analogue years relates to the brevity of the high-quality TC data set (only 41 years) and the limited number of similar analogues to this season.
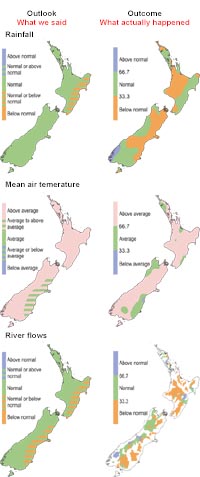
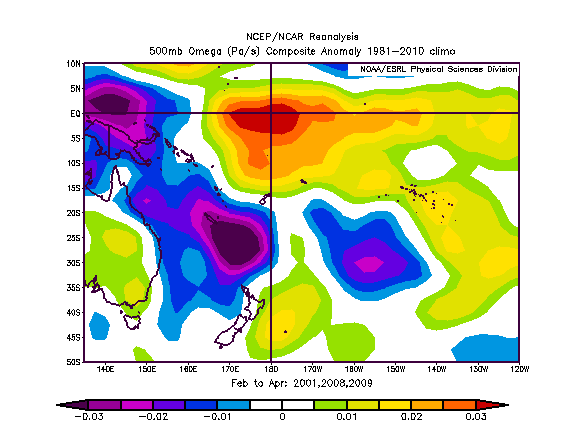
Global climate models suggest La Niña is likely to persist through Austral summer and into autumn. Despite moderate coupling of La Niña at present, the event has shown some signs of plateauing, while SST guidance indicates some weakening in the coming three months. The three analogues identified also suggest some coupling extending through the TC season (one analogue), or deterioration of La Niña into an SOI-NINA event (an atmospheric dominated event) for February-April. An analysis of past tracks using the South Pacific Enhanced Archive of Tropical Cyclones (SPEArTC) data set (Diamond et al., 2011) suggests it is possible that reduced activity for large parts of the southwest Pacific is likely in this scenario (see Figure 1). Tracks associated with the analogue seasons are seen in Figure 2. The late season projection is still consistent with the subtropical jet and the South Pacific Convergence Zone (SPCZ) being displaced southwest of normal during La Niña years (see Figure 3). TC genesis regions are expected to be shifted north and west of normal within the Coral Sea during this time, and while there is reduced likelihood of a Category 5 system occurring, one could happen as indicated by one of the three analogue years[1]. Based on averages for the analogue years, a total of 6 storms for the late season are expected, and the range of variation between analogues suggests 8 – 10 for the total TC count (November-April) is likely. Southeasterly track orientations during extratropical transition (ETT) are expected in the region with a mean ETT to the east of the Dateline south of Niue during the late season. The ETT position also corresponds with the higher than normal count of ex-tropical cyclones that are expected far to the east of New Zealand during the late season.
TC intensity is related to how long developing systems reside in the deep tropics and feed on warm waters for their growth, and how the subtropical jet and SPCZ mutually interact and contribute to shear during ex-tropical transition. It should also be noted that the interplay of the hemispheric-scale atmospheric circulation with the timing of a Madden-Julian Oscillation (MJO) passage can also significantly contribute to TC activity in the region. As discussed in the ICU 137 teleconference (Week 1 of February 2012), enhanced MJO-related convective activity over the western Equatorial Pacific was forecast for weeks 2 and 3 of February 2012. The MeteoFrance tropical cyclone forecast guidance, which is MJO-based, illustrated high probability of TC action in the SW Pacific for week two of February. The MeteoFrance forecast has proved to have good skill with a one week lead this season, and it currently suggests some activity could continue into week 3 of February 2012. MJO pulses are usually six weeks apart, on average, and as such additional activity may occur in mid-to-late March and again in late April.
Australian/FMS category scale for TCs and winds Cat 1 = 34-47 knots (63-87 km/h) Cat 2 = 48-64 knots (88-119 km/h) Cat 3 = 65-85 knots (120-158 km/h) Cat 4 = 86-106 knots (159-196 km/h) Cat 5 = > 106 knots (> 196 km/h)
Analogue guidance summary
At least 6 named storms are expected for the 2011-12 late season, based on an assessment of the analogues selected for this forecast. Keeping in mind the small sample size, and that two of the three analogues had 7 or 8 named TCs, a forecast of 8-10 total named storms for the November 2011-April 2012 period is most likely.
At least one storm is expected to reach Category 4 status, which is in line with the medium term climatology (last 15 years) that suggests at least one storm of Category 4 strength is likely.
In one of the three analogue seasons, at least one ex-tropical cyclone came within 550 km of New Zealand, indicating slightly reduced likelihood of an ex-tropical cyclone interaction despite the expectations of continuing La Niña conditions.
[1] TC Jasmine reached a Category 5 status during the time this guidance document was being crafted.
References
Gergis, J. and A.M. Fowler (2005), Classification of synchronous oceanic and atmospheric El Niño-southern Oscillation (ENSO) events for palaeoclimate reconstruction. International Journal of Climatology, 25, 1541-1565.
Diamond, H.J., Lorrey, A.M., Knapp, K.R. and Levinson, D.H. 2011. Development of an enhanced tropical cyclone tracks database for the southwest Pacific from 1840-2010. International Journal of Climatology, DOI:10.1002/joc.2412.
Diamond, H.J., Lorrey, A.M. and Renwick, J.A. 2012. A Southwest Pacific Tropical Cyclone Climatology and Linkages to ENSO. In review, Journal of Climate.
[1] TC Jasmine reached a Category 5 status during the time this guidance document was being crafted.
In the Pacific Islands:
Please contact your local national meteorological service for information about how this guidance should be interpreted.