Some commonly-asked questions about tornadoes in New Zealand.
Note: Unless specified otherwise, all mentions of 'tornadoes' refer to tornadoes here in New Zealand.
Q: Are tornadoes common in New Zealand?
Tornadoes are relatively rare events here. On average, there are around 7-10* moderate to strong tornado events reported in New Zealand each year.
Fatalities associated with tornadoes are also rare here. The most recent cases are Hobsonville (Auckland) in December 2012 (three deaths), Albany (Auckland) in May 2011 tornado last year (one death), and near Waitara in August 2004 (two deaths).
* See final question/answer.
Q: How often is Auckland affected by tornadoes?
Auckland is hit by a tornado on average less than once per year, but there is a lot of variation from year to year, with some years seeing no tornadoes at all.
Q: Are New Zealand tornadoes similar to the tornadoes which happen in the United States?
Tornadoes here aren't as common or as destructive as those that occur over the plains of the United States.
However, even small-scale tornadoes can cause damage, injury and even deaths. The west coast of the South Island and the North Island coast from Taranaki to Northland have been particularly affected by tornadoes in the past.
Q: How big are New Zealand tornadoes?
Tornadoes here are usually around 20-100m in diameter (wide) and tracks (travel) for just a couple of kilometres. They are extremely localised and the damage is very confined to the tornado itself, although the violent winds can fling debris hundreds of metres away from the tornado and cause considerable damage.
Q: How long do tornadoes in New Zealand last?
A tornado will typically last for a few minutes.
Q: How far do tornadoes travel?
Tornadoes will generally travel across the land for 2 to 5 kilometres.
Q: What wind speeds do tornadoes reach?
Most New Zealand tornadoes are relatively small and have ratings of EFO to EF1, i.e. speeds between 105 and 180 km/h.However, on rare occasions EF2 (180 to 220 km/h) tornadoes have occurred, and one instance of an EF3 (220-265 km/h) in 1948 in the Hamilton suburb of Frankton.
Note: At the more extreme end, some tornadoes track for over 100 kilometres, are over 1 kilometre wide and have winds up to 480 km/h – such tornadoes are extremely rare, anywhere in the world.
Q: What causes tornadoes here?
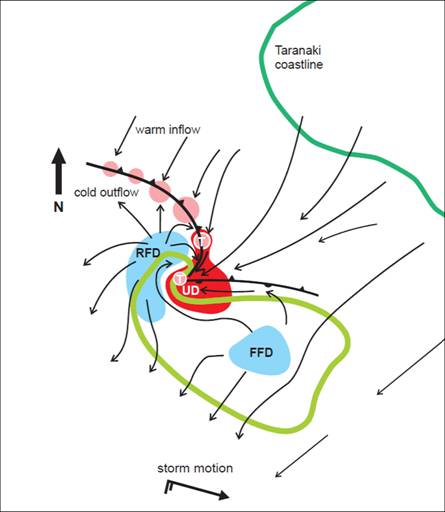
In New Zealand, most tornadoes are associated with pre-frontal squall lines - bands of thunderstorms embedded in a strong, unstable pre-frontal northwesterly flow. The thunderstorms have very strong updrafts and if these occur in an environment in which the wind directions rotate counterclockwise as the air rises, the updraft can start to spin and a mesocyclone can form. Tornadoes are spawned from these mesocyclones, which can be as little as 1-2 kilometres across.
Q: What are the warning signs of a tornado?
- Hail or heavy rain followed by dead calm or a fast, intense wind shift.
- Hail stone size can indicate storm intensity.
- Load continuous roar or rumble, much like the sound of an approaching freight train.
- At night, small, bright, blue-green to white flashes at ground level near a thunderstorm.
- A large, dark, low-lying cloud.
- A cloud of debris. An approaching cloud of debris can mark the location of a tornado even if a funnel is not visible.
For more information, see our 'Extreme weather - winds and tornadoes' page
Q: I've seen much higher numbers of tornadoes quoted in the media – why the difference?
Sometimes numbers like "20-30 tornadoes are observed in NZ per year" appear in the media and seem to be originate from a Civil Defence fact sheet, which conflicts with the number we quote of 7-10 "reported" tornadoes per year.
The discrepancy can be partly attributed to the reasons below.
Tomlinson (1) says that the average of reported tornadoes is about 15-17, and suggests that about twice as many actually occur but about half are unobserved as they occur in sparsely populated areas. As a recent example, on July 5 2007 in Taranaki there were 7 confirmed tornados (either by eye witness or by damage survey), but likely about 20 overall given the damage in other areas spotted by helicopter.
The period Tomlinson looked at (1961-1975) seems to have been much more active than the 25 years that followed, up to about 2000 where the 1980s and 1990s seemed to be quiet, but activity has picked up again since then though not to the same extent as 1961-1975. Anecdotally the 1950's were apparently quite active as well.
Also, waterspouts appear to have been included by Tomlinson and we would not necessarily include waterspouts now in our annual count, especially if there was an indication that they were a true – i.e. not associated with a thunderstorm – waterspout (like the ones off Lyall Bay in Wellington in 2012) rather than a tornado over water (like Hokitika earlier in 2013, which did eventually came ashore and caused damage in the town).
There is also an issue with counting the tornadoes themselves, for example, counting some historic cases with multiple tornadoes as only one tornado. Sometimes two or three may have occurred but a historic newspaper account may report only one; alternatively, old climate summaries may have counted "days when a tornado occurred", meaning that if two occurred on one day they would have been counted together as one.
Seelye (2) in 1945 quotes nine reported per year, which is much closer to what we have been getting the last few years.
In the past few years, numbers quoted in the NIWA/GNS natural hazards annual summary have been something like 7-10 damaging tornadoes reported per year. So not only do we have considerable year-year variability but decade-to-decade as well.
References:
- Tomlinson, A.I., Nicol, B. 1976: Tornado reports in New Zealand 1961-1975. Technical Note 229. New Zealand Meteorological Service, Wellington
- Seelye, C.J. 1945: Tornadoes in New Zealand. New Zealand Journal of Science and Technology. 27.166-174