If you list all the historic rainfall totals for a particular month and for a specific location, rank these from lowest to highest, then divide the list into ten equal parts, you have identified the ten rainfall deciles for that month and for that location. A particular monthly rainfall total can then be compared with these deciles to put it into an historical context. For example, if a month's rainfall (say February 2013) for a particular site is in the first (or lowest) decile, then its total is less than 90% of all the February rainfall totals for that site (i.e. at least a "1-in-10-year" low value). The decile maps have been generated from data collected at climate stations throughout the country (shown as dots on the maps) since a base year of 1972.
Click on the maps for larger images.
Monthly Rainfall Deciles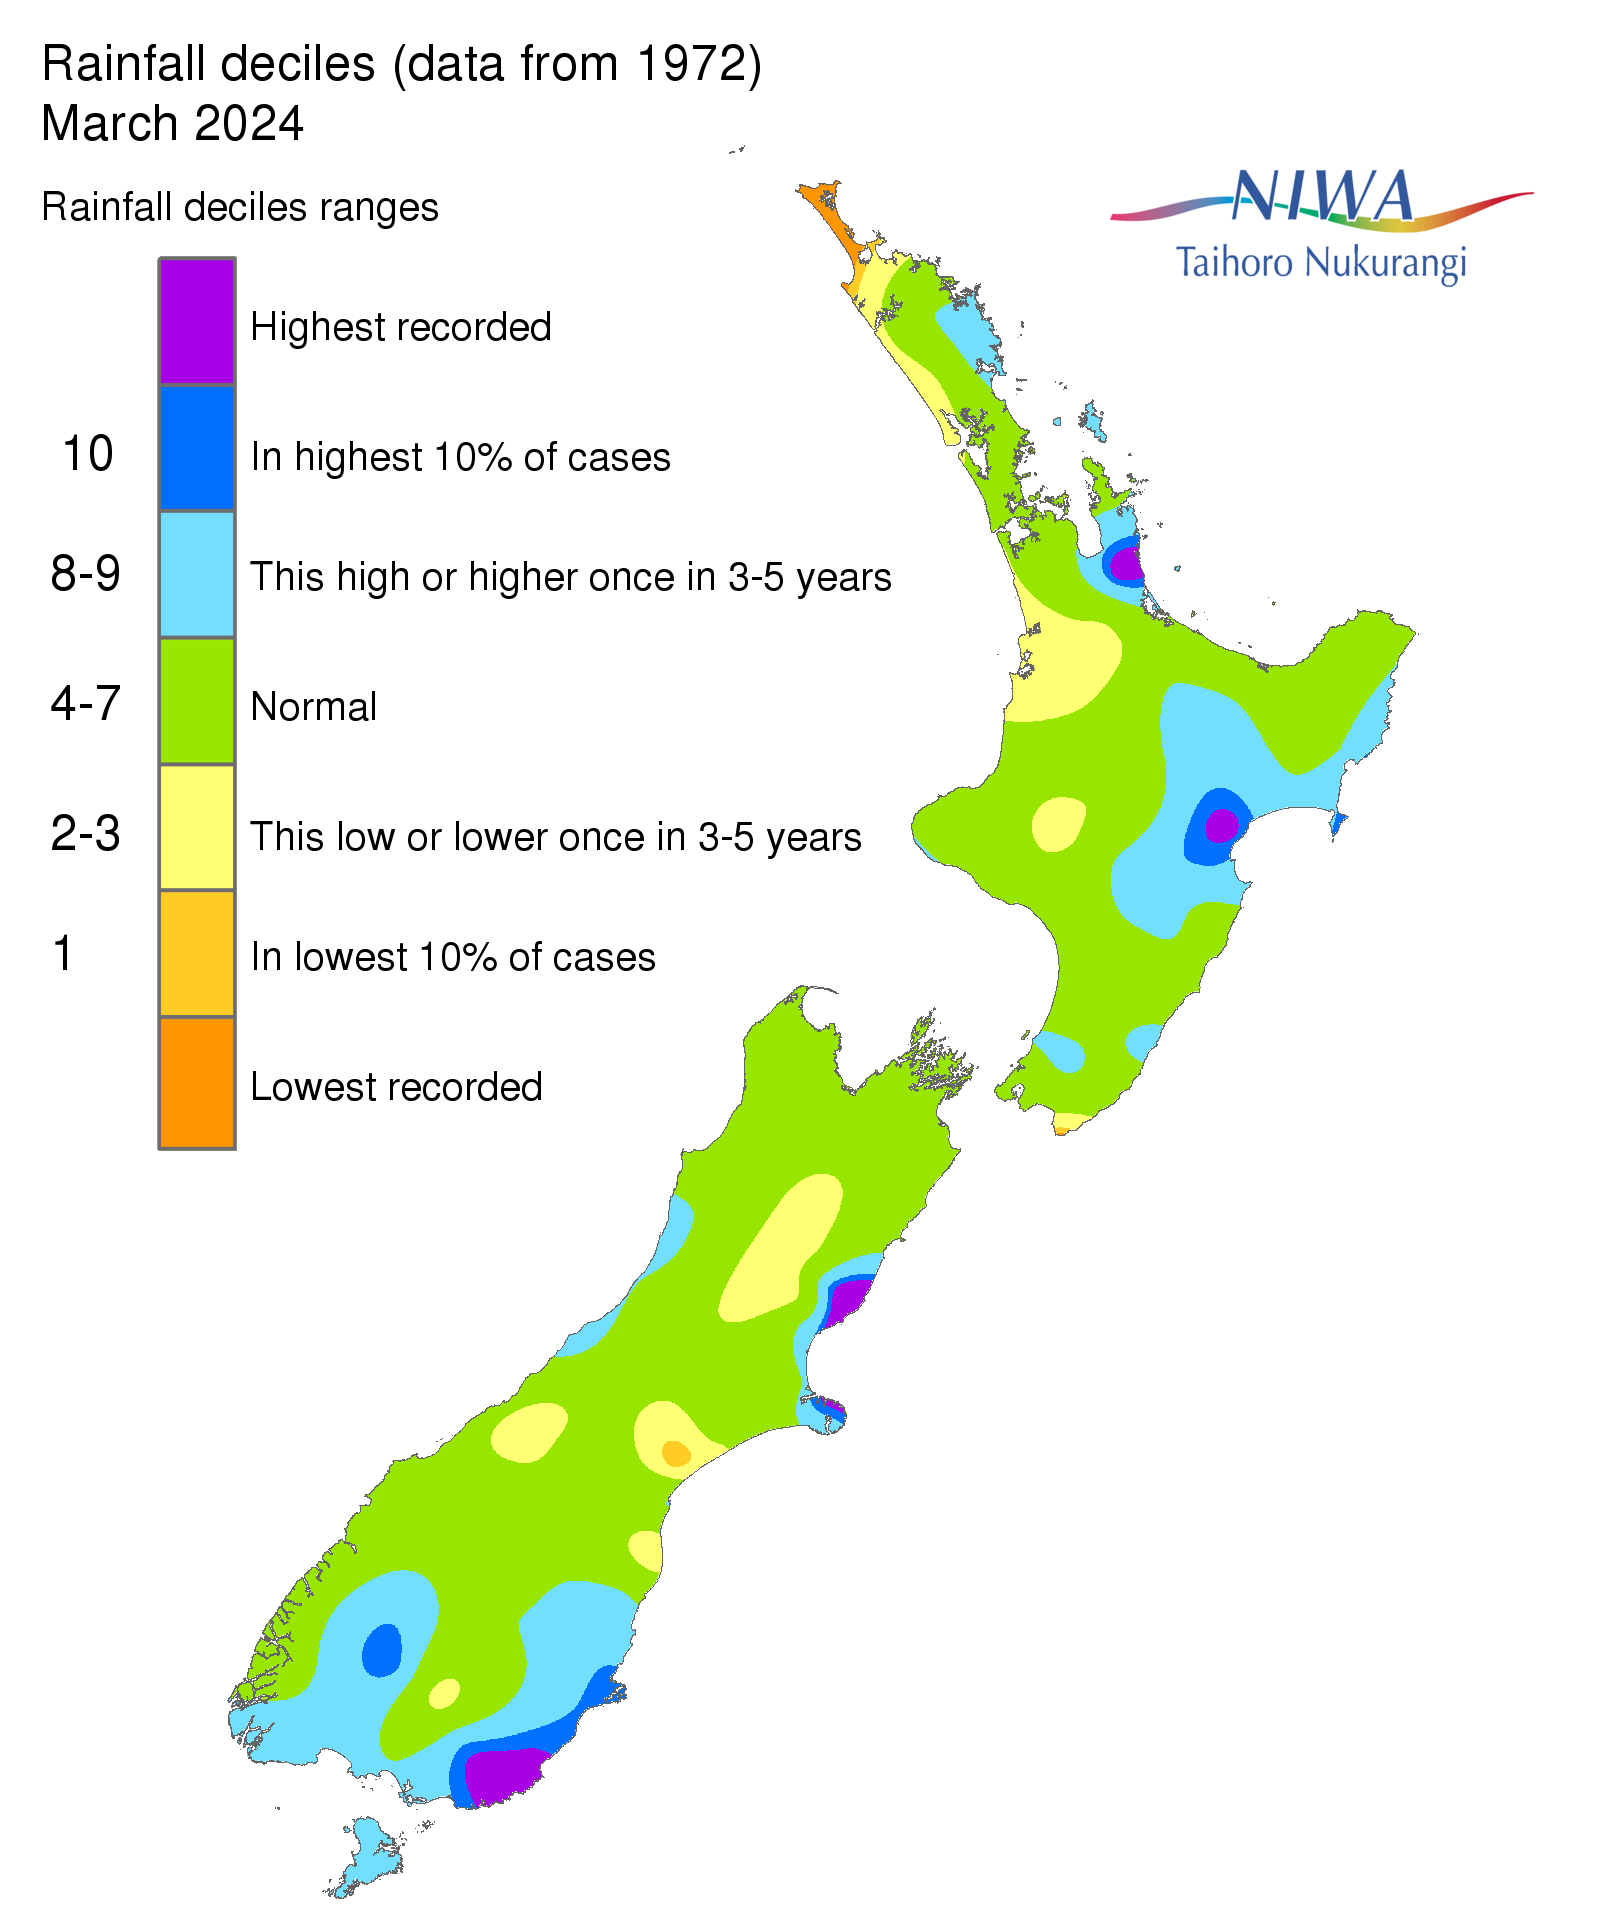
|
Decile Drought Indicators
- If the monthly rainfall total is in the bottom three deciles, then rainfall has been much below normal and drought (if not already present) may be imminent. This is particularly the case if last month's rainfall is in the bottom decile, or lowest ever recorded.