What’s the difference between weather and climate?
Weather vs. Climate
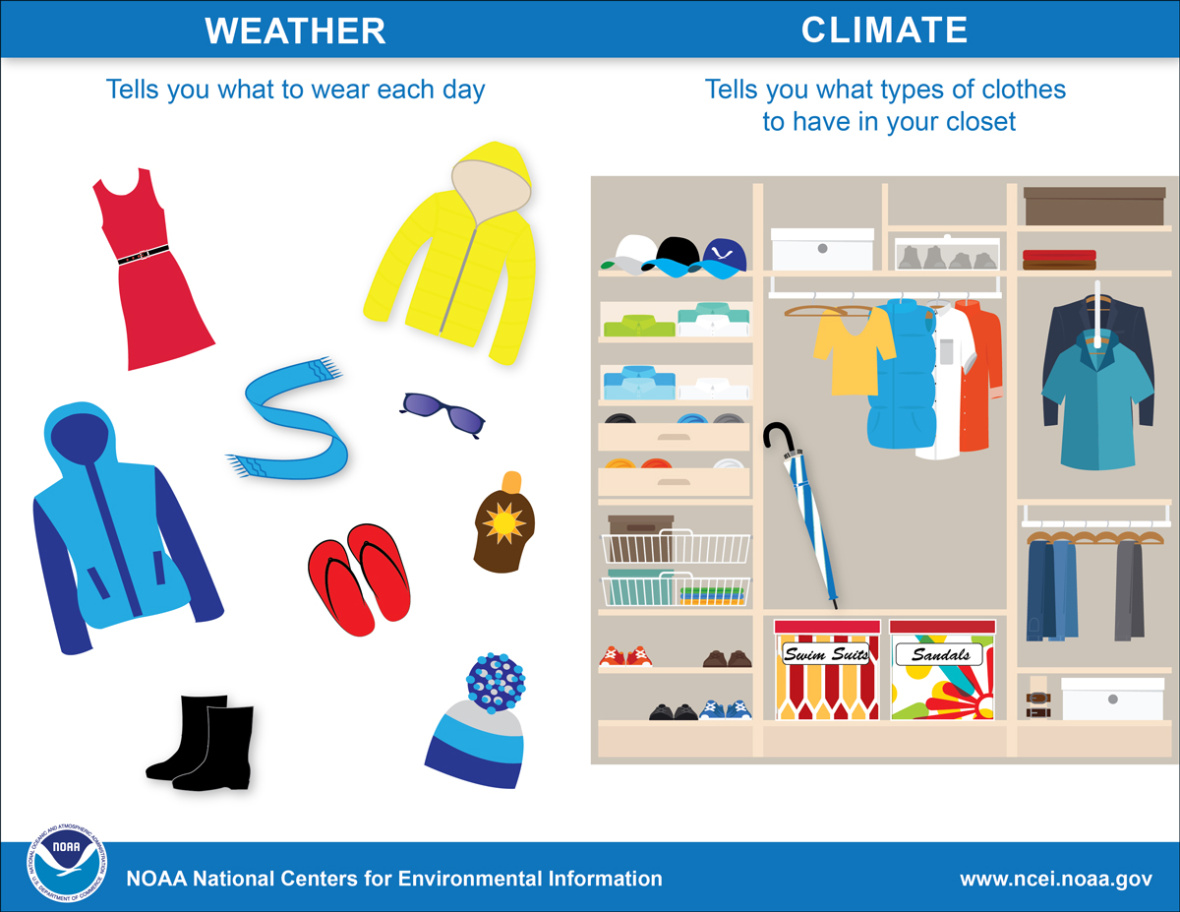
While weather and climate are closely related, they’re not the same thing. Weather can be thought of as what you see out of your window every day, such as when it’s sunny, cloudy, rainy, or windy. Essentially, weather is what we see and feel in the short-term, over the span of minutes, hours, or even a couple of days.
On the other hand, climate describes what conditions are like for a specific area over a long period of time. To determine this, climate scientists look at averages of weather parameters such as rainfall, temperature, sunshine, wind speed, and others over a long period of time--typically 30 years. These long-term averages of weather observations are known as climate normals. Although the weather can change dramatically from day-to-day, long-term climate normals help scientists determine trends and patterns over the span of decades or more.
Climate provides a general idea of the conditions we can expect during a season or a year, but it doesn’t tell us what the weather will be like on any given day. For example, climate normals can tell us what the average high temperature is in Auckland during December, but it can’t tell us what the exact high temperature will be in Auckland on 15 December next year.
In short, climate is what we expect, while weather is what we get.
What is a mass spectrometer?
From crime scenes to the bottom of the ocean, scientists are often analysing samples to find out what chemicals they contain, and this often involves a mass spectrometer. But what is a mass spectrometer, and how do they work?
Light can be split by a prism into a spectrum of different colours which take different paths. Mass spectrometers use different physics to produce a similar end result, but with molecules with different masses taking different paths, producing a 'mass' spectrum.
Mass spectrometers use an interesting mix of physics to charge, accelerate and then deflect the path of atoms and molecules. Once an electron is removed from an atom or molecule, they respond strongly to electric and magnetic fields, and are referred to as ions.
Making the ions fly through a strong magnetic field curves their path, but because the force is proportional to the charge, heavier molecules are deflected less, fanning the paths of the ions out similar to the spectrum produced by an prism. Charge sensitive detectors sit at the end of the flight path, and every time an ion is collected it produces a current, which is recorded and used to calculate the ratio of different masses.
If you use a sample with a huge mix of molecules with different masses, it can end up to be almost impossible to work out what a sample is made of. However, with careful preparation samples can reveal an enormous amount.
How NIWA uses mass spectrometers
NIWA uses the ratios of different types, or isotopes, of oxygen to perform a lot of its research. Not all oxygen atoms are the same. The centre, or nucleus of an atom is what makes up the majority of its mass, and consists of protons and neutrons. The number of protons (8) is always the same, but the number of neutrons can vary, and these different varieties are known as isotopes. Although over 99% have 8 neutrons (16O), oxygen also comes with 10 neutrons (18O around 0.2%), and 9 (17 O less than 0.04%). This last one is so rare we'll leave it out of the following example to make it simpler.
Because 18O is heavier than 16O, water molecules (H2O) which contain the 'heavier' oxygen are slightly less likely to evaporate than water comprised of the 'light' oxygen. This means that rain and snow has, on average, a slightly different ratio of 18O to 16O (δ18O) than the ocean. We can detect this small difference with a mass spectrometer. This effect is stronger for the warmer parts of the ocean, which leads to different parts of the ocean having different δ18O ratios, which we can see across the ocean today.
Using δ18O to see into the past
During ice ages, water that evaporated from the ocean preferentially contained 16O and went on to be trapped as snow and ice at the poles, trapping the 16O, which means the overall the ration of 18O in the ocean went up. Because sea creatures use oxygen in their hard parts (shells), it can match the water they live in, and after they die their remains build up on the sea floor, it's possible to see a pattern of different ice ages going back hundreds of thousands of years in sediment cores from the seabed. These changes in δ18O are very small, but modern mass spectrometers are enormously sensitive, they've come a long way since they were invented in 1912.
We can use this information to work out what ocean conditions were like in the past when ancient snow was formed, or what ocean temperatures were like when sea creatures were alive. Both these techniques involve drilling cores deep into glaciers or the sea bed, allowing us to get data ranging back hundreds of thousands of years. There are limits to what can be determined from these kinds of temperature measurements, or proxies, as they are known, but when multiple different proxies agree with each other it greatly increases our confidence in the results.
For example, in younger ice cores you can see lines for each winter's heavier snowfall and count them like tree rings. It's also possible to calculate how much snow fell each year. You can take the same slice of snow and analyse its δ18O ratio, and see that it is opposite the signal in the ocean, i.e. as the 16O is removed from the ocean it ends up in icecaps. Rare events like volcanic eruptions, which can also be dated in a number of other ways, leave ash signals in ice cores and ocean sediments, which means we can increase our confidence in the conclusions we draw from these data.
Carbon 13
Similar work is carried out with isotopes of carbon. Carbon 14 (14C) is famous for its use in dating because it undergoes radioactive decay, and the early parts of ice cores can be be dated in this way. However, there are two non-radioactive, or stable, isotopes of carbon 12C and 13C. These have different effects on chemical and biological reactions, similarly to δ18O, which can tell us about sources of carbon in the atmosphere of the day.
In practice, the samples we work with are usually carbon dioxide, or CO2, which gives us several likely combinations of stable isotopes of carbon and oxygen:
| 16O | 16O | 18O |
| 16O | 16O | 16O |
| 12C | 13C | 12C |
| 44 | 45 | 46 |
This means we can discover information about the temperature of ancient oceans and the sources of ancient carbon in carbon dioxide from the samples of CO2 from air trapped in different parts of an ice core. This allows us to see how ocean circulation patterns, carbon sinks and a whole host of other systems changed as previous ice-ages came and went over hundreds of thousands of years. This will help predict how adding greenhouse gases to the atmosphere today will go on to affect the earth in future.
What is the greenhouse effect?
The greenhouse effect is a warming of the earth's surface and lower atmosphere caused by substances such as carbon dioxide and water vapour which let the sun's energy through to the ground but impede the passage of energy from the earth back into space.
A simplified diagram illustrating the greenhouse effect (based on a figure in the 2007 IPCC Science Assessment) is available to the right.
Energy emitted from the sun ("solar radiation") is concentrated in a region of short wavelengths including visible light. Much of the short wave solar radiation travels down through the Earth's atmosphere to the surface virtually unimpeded. Some of the solar radiation is reflected straight back into space by clouds and by the earth's surface. Much of the solar radiation is absorbed at the earth's surface, causing the surface and the lower parts of the atmosphere to warm.
The warmed Earth emits radiation upwards, just as a hot stove or bar heater radiates energy. In the absence of any atmosphere, the upward radiation from the Earth would balance the incoming energy absorbed from the Sun, with a mean surface temperature of around -18°C.
The presence of "greenhouse" gases in the atmosphere, however, changes the radiation balance. Heat radiation (infra-red) emitted by the Earth is concentrated at long wavelengths and is strongly absorbed by greenhouse gases in the atmosphere, such as water vapour, carbon dioxide and methane. As a result, the surface temperature of the globe is around 15 °C on average, 33 °C warmer than it would be if there were no atmosphere. This is called the natural greenhouse effect.
And the enhanced greenhouse effect?
If extra amounts of greenhouse gases are added to the atmosphere, such as from human activities, then they will absorb more of the infra-red radiation. The Earth's surface and the lower atmosphere will warm further until a balance of incoming and outgoing radiation is reached again (the emission of infra-red radiation increases as the temperature of the emitting body rises). This extra warming is called the enhanced greenhouse effect.
What are El Niño and La Niña?
The El Niño - Southern Oscillation (ENSO) is a natural feature of the global climate system that influences air pressure, rainfall, temperature, and wind patterns around the world.
It’s a coupled ocean-atmosphere phenomenon, meaning that the ocean and atmosphere work in tandem to cause fluctuations in the global climate.
ENSO has three phases: El Niño, La Niña, and neutral. El Niño and La Niña events occur, on average, every 3-5 years. El Niño events tend to last for up to a year, while La Niña can linger on for 1-3 years.
NIWA issues ENSO predictions every month in its Seasonal Climate Outlook.
El Niño – warm seas in the equatorial Pacific
During El Niño events, easterly winds along the equator, called trade winds, weaken. This leads to a rise in sea surface temperatures in the central and eastern equatorial Pacific near South America as warmer water moves in from the west.
This unusually warm ocean water puts more energy into the atmosphere to form clouds, rainfall, and thunderstorms – ultimately influencing weather patterns around the world.
During El Niño, New Zealand tends to experience stronger, more frequent winds from the west in summer, which can encourage dryness in eastern areas like Hawke's Bay, Gisborne, Canterbury, and Otago, and more rain in the west, like along the West Coast. In winter, the wind tends to blow more from the south, causing colder temperatures across the country.
Elsewhere, the odds for heavy rainfall and flooding increase over Peru, as does the risk for drought over Indonesia and Australia. In the tropical South Pacific the pattern of occurrence of tropical cyclones shifts eastward, so there are more cyclones than normal in areas such as the Cook Islands and French Polynesia.
La Niña – cool seas in the equatorial Pacific
During a La Niña event, the trade winds strengthen, allowing ocean water off the coast of South America to the central equatorial Pacific to cool. This happens because stronger winds churn cooler, deeper sea water up to the ocean’s surface – a process known as upwelling.
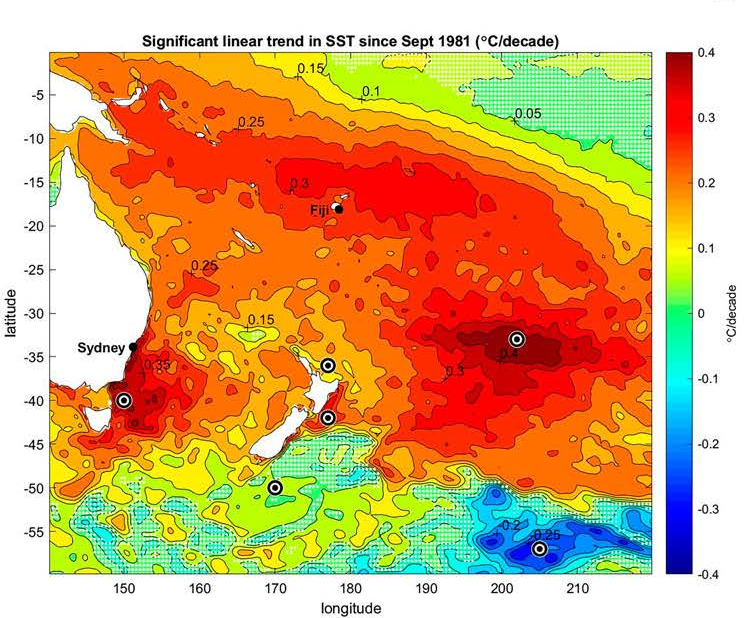
During La Niña, New Zealand tends to experience more north-easterly winds, bringing moist, rainy conditions to north-eastern areas of the North Island and less rainfall to the lower and western South Island. La Niña summers also tend to be warmer and can come with a risk for marine heatwave conditions in New Zealand’s coastal seas.
For New Zealand, north-easterly winds become more common during La Niña events, bringing moist, rainy conditions to north-eastern areas of the North Island and less rainfall to the lower and western South Island.
How is ENSO measured?
Because ENSO is a coupled ocean-atmosphere phenomenon, it is monitored by both oceanic and atmospheric indicators.
In the atmosphere – the Southern Oscillation Index
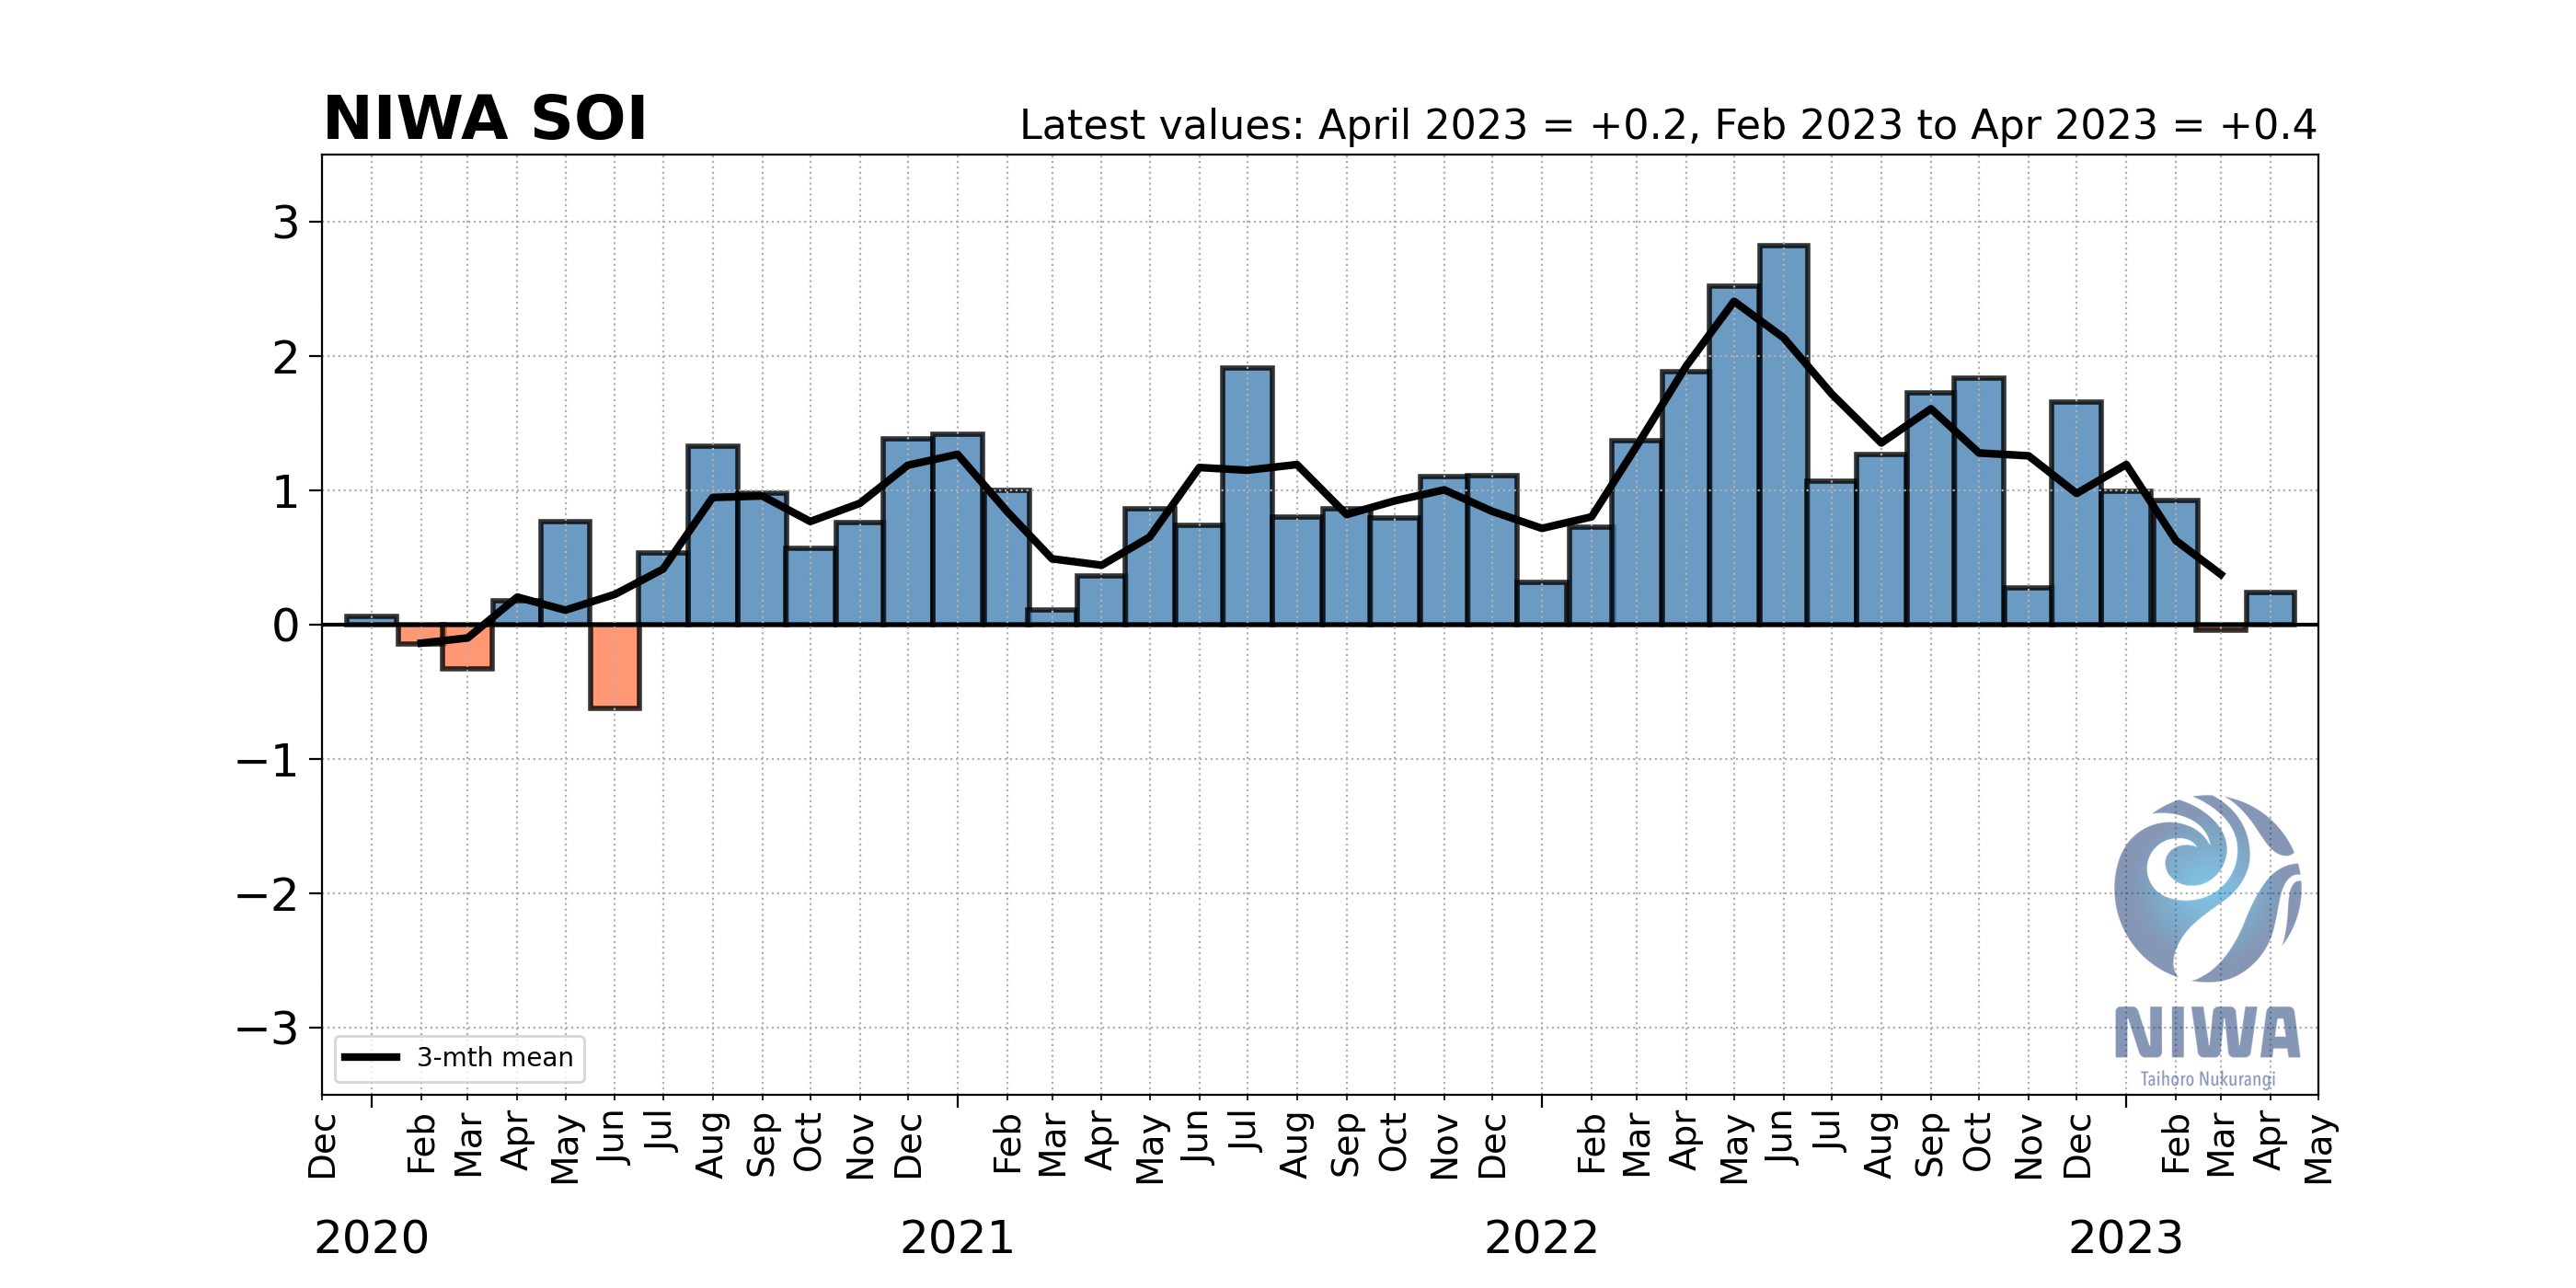
One key atmospheric indicator is called the Southern Oscillation Index or SOI.
Sir Gilbert Walker documented and named the Southern Oscillation in the 1930s. The clearest sign of the Southern Oscillation is the inverse relationship between surface air pressure at two sites: Darwin, Australia, and the South Pacific island of Tahiti.
Over periods of a month or longer, higher pressure than normal at one site is almost always concurrent with lower pressure at the other, and vice versa. The pattern reverses every few years. It represents a "seesaw", a mass of air oscillating back and forth across the International Date Line in the tropics and subtropics.
When the Southern Oscillation Index is positive, air pressure at Tahiti tends to be higher and lower at Darwin. The reverse is true when the index is negative.
Over a period of three months or more, SOI values below -1 correspond to El Niño conditions while values above 1 correspond to La Niña conditions. Values between -0.5 and -1.0 lean toward El Niño, while values between 0.5 and 1.0 lean toward La Niña. Values between -0.5 and 0.5 are considered neutral.
In the ocean – the NINO34 Index
An important oceanic indicator is called the NINO34 Index. The NINO34 Index represents the sea surface temperature in a region in the central equatorial Pacific whose conditions are strongly influenced by ENSO.
When the NINO34 Index has been 0.7˚C warmer than average for several months, it can be said that oceanic El Niño conditions are occurring.
When the NINO34 Index has been 0.7˚C cooler than average for several months, oceanic La Niña conditions are occurring.
NIWA synthesises both SOI data and NINO34 Index in its Seasonal Climate Outlook, with updates issued once a month.
How do we determine past climate?
Information about past climate is obtained from piecing evidence together from various sources.
These include:
- Ice cores: The ratio of oxygen isotopes in ice indicates the temperature at the time ice was deposited as snow. Also, air bubbles can be analysed to measure carbon dioxide and methane concentrations at the time the bubbles were trapped in the ice.
- Fossil pollen: Different classes of plants produce pollen grains with different distinctive shapes. Such pollen grains are often found preserved in sediment cores from ponds, lakes and oceans. They provide information on the type of plants that grew nearby when the sediments were formed.
- Lake sediments: Composition and sedimentation rates change in response to environmental conditions. Pollen in the sediments can indicate the type of vegetation present, and plankton biota indicate physical and chemical conditions in the lake water.
- Ocean sediment cores contain primitive shelled animals (foraminifera) whose abundance in the surface layers of the ocean depends on surface water temperature and other conditions.
- Loess is deposits on land of wind borne material. Its accumulation at a particular location can provide information on past windiness and dryness.
- Glaciers: Variations in the past size of glaciers can be inferred from the location of moraines (rocks and debris deposited by glaciers) and buried soils, and in the presence of glacial features in the landscape. In New Zealand, cool summer temperatures are only one factor in promoting ice accumulation on glaciers, and snow accumulation rates also respond to changes in the strength and direction of the westerly wind flow and sea level pressure in summer.
- Speleothems: Glacial deposits embedded within speleothems (stalactites and stalagmites) can be used to indicate periods of glacial advance (the speleothems can be dated using uranium isotope techniques). A cave in Fiordland New Zealand, which has been repeatedly overrun by glaciers, provides information going back 230,000 years.
- Tree ring width depends on the soil moisture, temperature and other growing conditions. Annual rings of trees in temperate forests can be used to reconstruct past climates.
- Boreholes: It is sometimes possible to deduce past surface temperatures going back several hundred years by measuring the way temperature varies with depth in a borehole several hundred metres deep (at a suitable site not disturbed by groundwater flow). This is because fluctuations in ground surface temperatures propagate slowly downwards into the earth as a "temperature wave".
- Instrumental measurements and written or oral records: In New Zealand, quantitative records of temperature and other meteorological records are available only for the past 150 years. Such records must be analysed carefully, to identify the influence of any non-climate factors (such as changes in observing site or method, or encroaching urban development).
Has the climate changed in the past?
The Earth's climate has exhibited marked "natural" climate changes, with time scales varying from many millions of years down to a few years.
For example:
- Changes in land and ocean floor topography have had major influences on global climate at time scales of 50 million to 150 million years. (These changes influenced the patterns of absorption of incoming radiation from the sun, and affected circulation patterns in the atmosphere and oceans).
- Over the last two million years the onset and recession of the great Ice Ages were probably influenced by changes in the earth's orbit and the tilt of its axis, which caused systematic variations in the amount and distribution of solar radiation. Global average temperatures varied by about 5 – 7 °C.
- Since the end of the last ice age (14,000 – 10,000 years ago) globally averaged surface temperatures have fluctuated over a range of up to 2 °C on time scales of centuries or more. Factors influencing these changes probably included fluctuations in the radiation output from the sun, and changes in circulation and overturning in the oceans.
- Over periods of a few years, fluctuations in global surface temperatures of a few tenths of a degree are common. Some of these are related to the El Niño – Southern Oscillation phenomenon, and major volcanic eruptions have also had some effects.
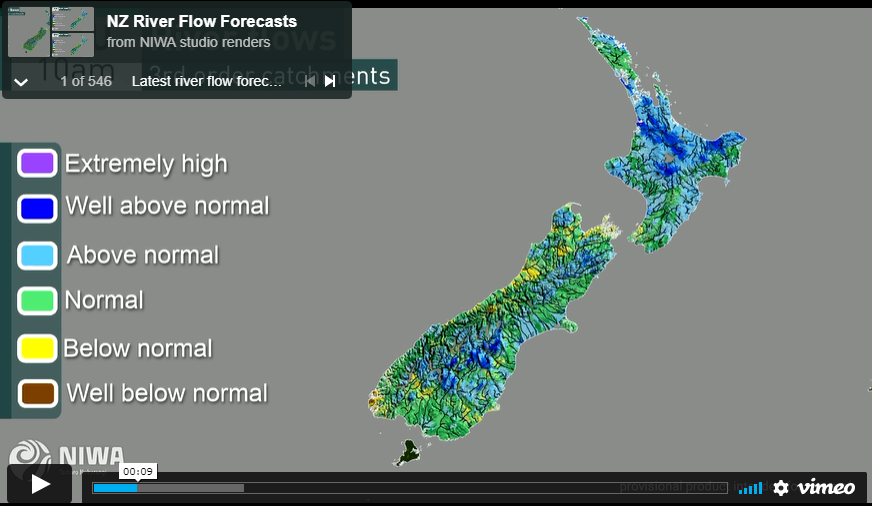
Why is there water flowing in a river when it isn’t raining?
In the absence of rain, most of the flow in a river is water that drains slowly from the ground.
As the groundwater is depleted, the flow rate in a river gradually recedes. The rate of recession is determined primarily by the underlying geology of the river basin. Some rivers, for example in the eastern Wairarapa where there is a tertiary mudstone geology, recede quickly and dry up in summer. Others, for example in the volcanic ash areas of the central North Island, have remarkably well sustained low flows. Some South Island rivers that drain the higher mountains of the Southern Alps are sustained in spring and summer by snowmelt, and experience lowest flows in winter when most of the precipitation is snow.