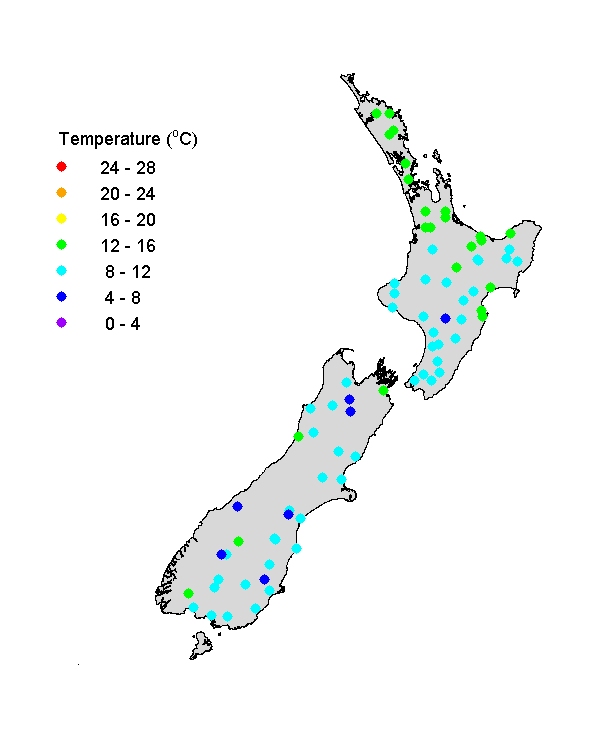
River temperatures April to June
Autumn river water temperatures were mostly in the range 8 to 16oC and tended to be slightly higher in the north and at lower altitude.
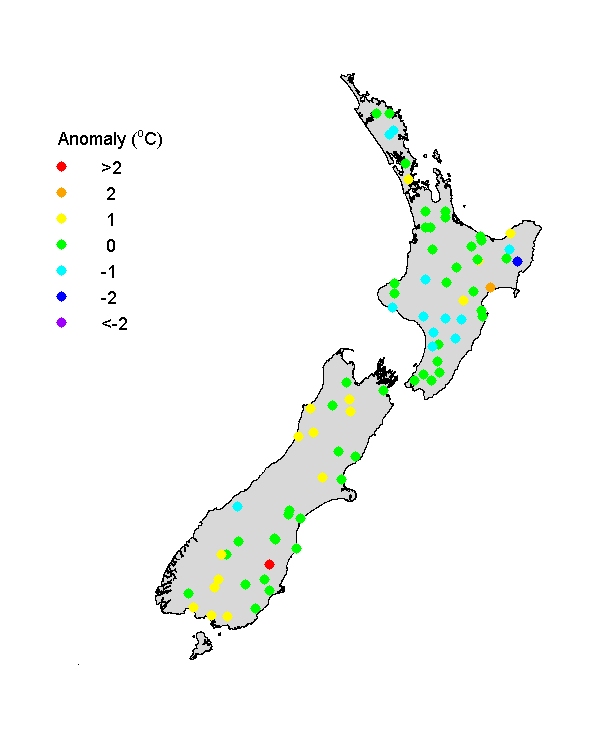
These weak, but distinct, altitudinal and latitudinal (S-N) trends are typical. The temperature anomaly graph shows that river water temperatures were fairly typical for autumn except for being slightly higher than normal over much of the South Island and somewhat lower than average in parts of the North Island. The North Island pattern might possibly reflect a legacy (thermal 'inertia') of unsettled, cool and wet weather through much of summer.
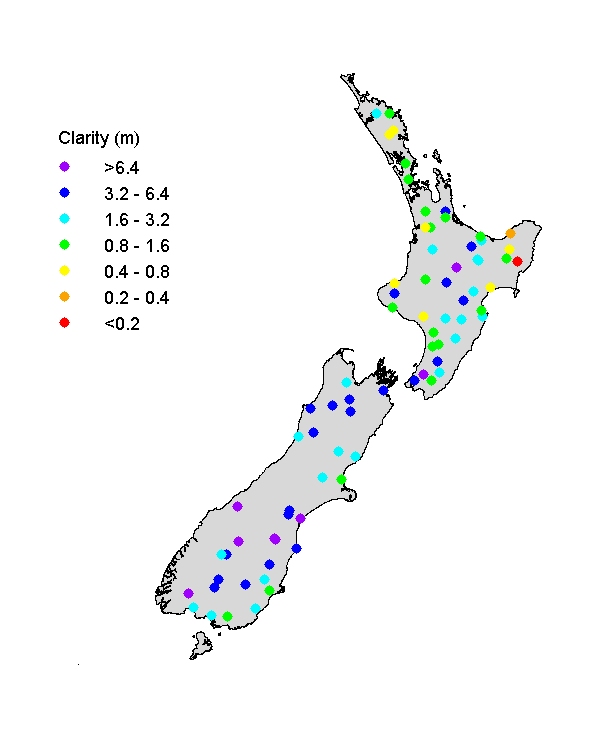
Visual clarity of rivers April to June
Visual clarity ranged widely, from <0.2m to >6 m, reflecting New Zealand's diversity of soil types and erosion resistance of rocks intersecting with land use patterns (rivers draining pastoral catchments are generally less clear than in forested catchments). The net result is that rivers in the South Island tend to be clearer than in the North Island. Visual clarity was higher than normal for autumn at many river sites in the South Island where flows, particularly in alpine-fed rivers, tended to be relatively low (This reflects the strong inverse relationship of visual clarity to flow state in rivers). Some rivers in parts of the North Island were also clearer than normal because of lower than normal flows, while the Motu River near East Cape, North Island, was unusually turbid reflecting high flows.