The issue
Regional economic development often begins with land-based investments. Such investments may include land-use intensification or diversification in the search for higher yields and/or new market opportunities.
The science-based approach used here is built around compiling detailed climate, soil, and topographic data and combining it with expert-derived crop and tree species growth requirement information in a GIS (mapping) environment.
Suitability maps are derived which delineate land where there is high (and low) potential for growing certain crops and tree species. Such maps can be used to focus more detailed site-specific investigations.
An easy-to-use map interrogation tool, which can be web- or CD-based, can also be produced.
The approach
Since 2003, teams of scientists from NIWA, Landcare, Plant and Food Research, and Scion have worked on three separate projects (for different locations and clients) with the goal of identifying the potential suitability of land for growing specific crops or tree species based on climatic, soils and topographic information. The projects were:
Western Kaipara and Hokianga: Crops investigated were peanut, Maori potato, manuka (for oil), banana, mate tea, avocado, cherimoya, fig, blueberry, hydrangea.
Tararua District: Crops investigated were feijoa, gevuina, ginseng, golden seal, hazelnut, passionfruit, rootstock grapes, saffron, truffles, valerian.
Gisborne District: Tree species investigated were blackwood, douglas-fir, eucalyptus fastigata, cupressus lusitanica, manuka, redwood.
Each project employed the same basic assessment methodology with the Gisborne District project also including a climate change analysis. Maps from these projects have been used in locally-run promotional programmes designed to provide public-good information and stimulate economic development.
The standardised methodology means similar land-use assessments (for any conceivable crop or tree species – given the availability of growth requirement information) can be made for any region in New Zealand.
The results:
Stage 1: Interpolation of climate and soil data
Climate and soil information is not measured directly at every point in New Zealand, so these variables need to be estimated in between the sites at which data are observed.
In general, a statistical technique is used for filling in the gaps between locations where data are available, using geographic variables such as location (latitude and longitude) and topographic information, such as elevation above sea level, to aid the interpolation.
Specifically for climate data, a thin-plate smoothing spline interpolation is used, where a smoothed surface is fitted to the data with some error allowed at each data point. In areas where there are large distances between measurement sites (e.g. in high elevation areas) the uncertainty in the estimation is likely to be highest.
Stage 2: Identification of growth requirements
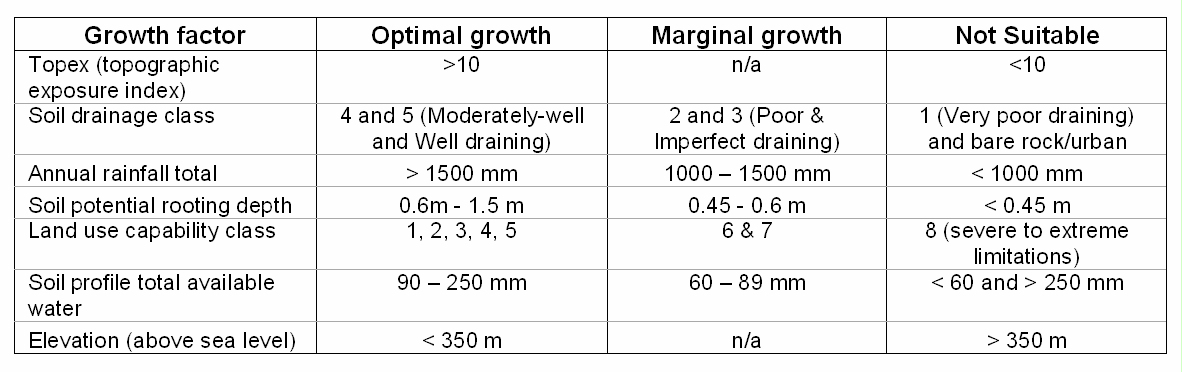
Climate, soil and topographic factors, which are known to be of importance for specific crop or tree species growth, are identified from detailed growth studies performed in New Zealand and abroad by experts in plant and tree sciences. Each growth factor is broken down into three categories: optimal, marginal, and not suitable. An example is shown in Table 1, for Blackwood.
Stage 3: Suitability maps
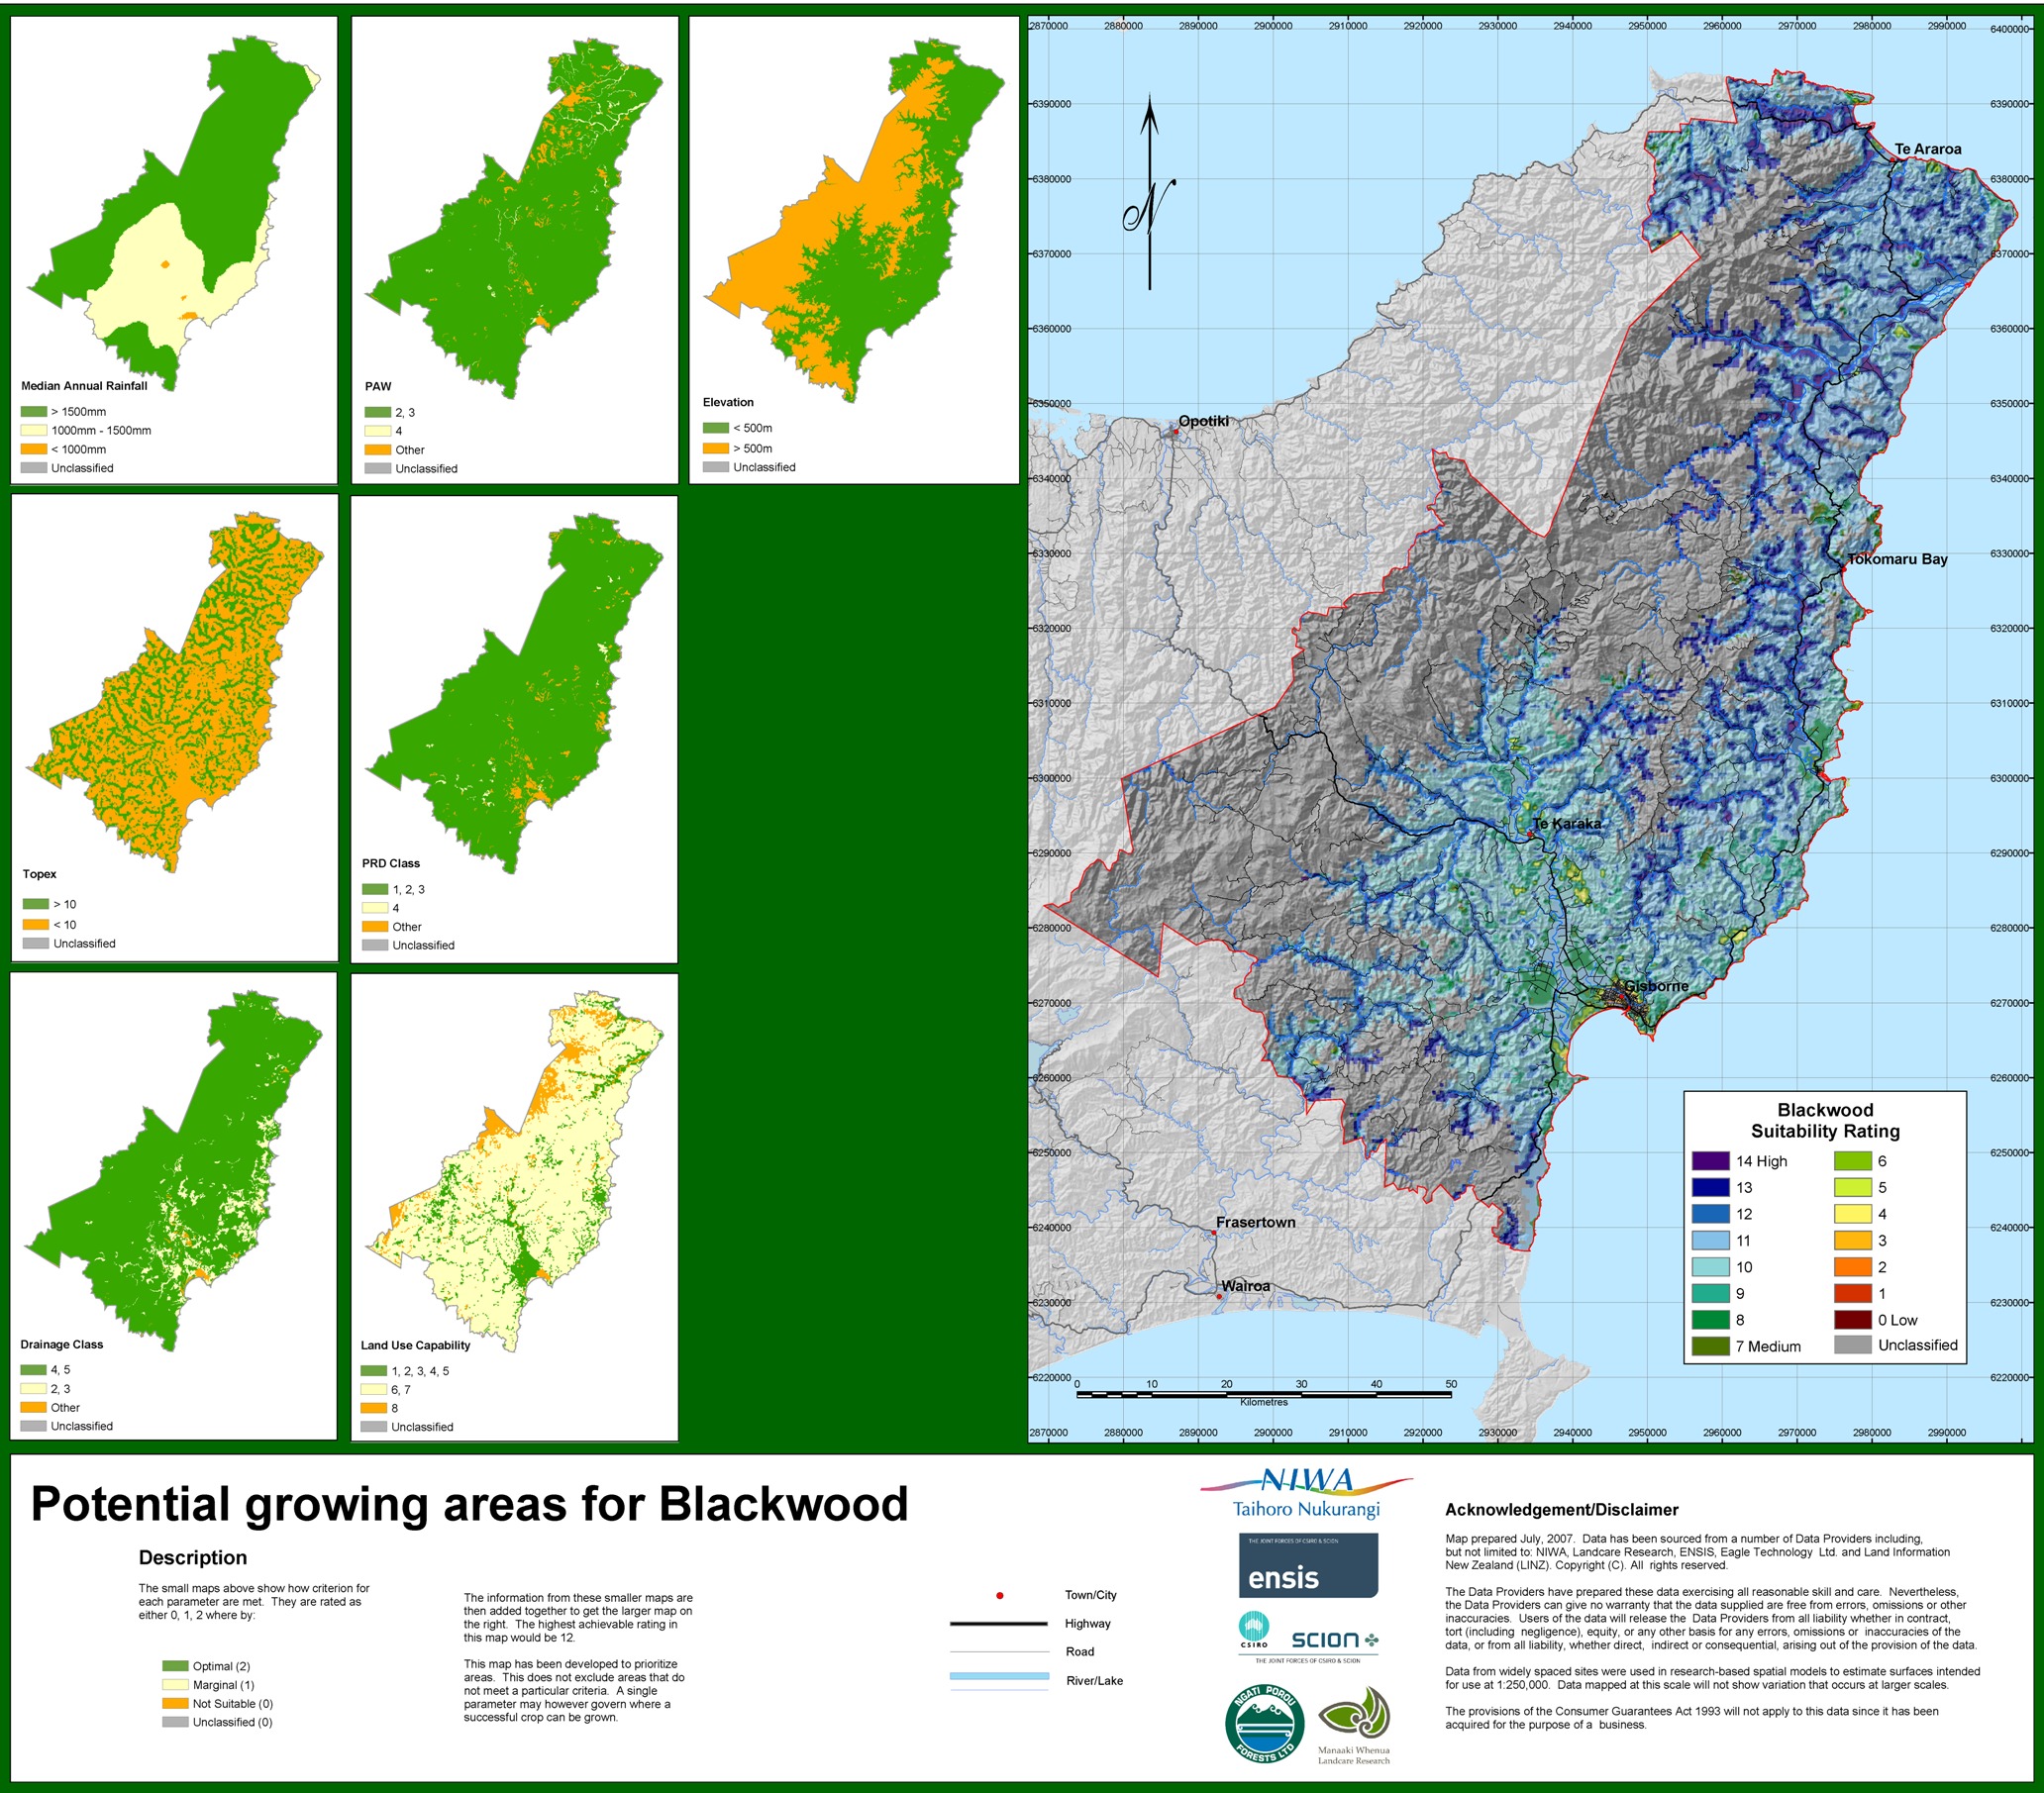
The overall suitability of an area to a particular crop or tree species is assessed using a simple additive model. Firstly, the three suitability categories (optimal, marginal, and not suitable) are assigned an integer value of 2, 1, and 0 respectively. Maps of these categories for each growth factor can then be produced (e.g., see the small maps in the Blackwood example below). The overall suitability index is then the sum of the individual growth factor suitability scores. In the case of Blackwood, there are seven important growth factors (see Table 1) so the maximum value of the overall suitability index is 14 (each of the seven factors is optimal, i.e. 7 x 2 = 14). The lowest possible index value is zero. Areas with suitability index values from 11 to 14 can be considered reasonably well suited to growing Blackwood (e.g., see the suitability map below, produced for the Gisborne District on behalf of Ngati Porou Whanui Forests Ltd).
Some growth potential maps have a "global limiter". This means that for a particular factor, areas that are deemed "not suitable" are directly translated as "unclassified" in the overall growth suitability map. An example of this is on the Blackwood growth potential map, where land above 350 m is deemed unsuitable for growth, regardless of the other growing conditions.
Projections of climate change can also be used to produce future growth potential maps. The methodology is exactly the same as that described above, whereby the individual parameter suitability scores are added together to produce a combined suitability index map. While many of the growth requirement maps remain unchanged (e.g. those to do with topographic exposure), changes to rainfall and temperature based growth requirement maps will influence the overall suitability.
It is advisable to look at the growth potential maps for broad areas which show "good potential" (in the top third of the suitability rating scores). Consider which topographic, soil and climatic factors limit the crop in these areas (from the individual growth factor suitability maps), and how you are placed to deal with these limitations.
Stage 4: Consideration of other factors
Information about relevant markets, costs, labour requirements, available infrastructure, processing requirements, transportation options and general information about "growing the crop" is also needed, in addition to an assessment of growth potential based on the climate, soil and topography. Growers’ associations and industry groups often have extensive information about practical methods and scientific research, including networks of other growers or consultants you can approach for more advice. Following that, once you have researched all that you can, if you still have particular problems or questions regarding a certain tree species, or a specific growing arrangement on your property, you might consider approaching a professional consultant.
Stage 5: A simple-to-use map interrogation tool
Due to the large number of maps that are typically produced in a project like this, it is highly desirable to have a tool which helps the user easily manage the information. In collaboration with GeoInfo Ltd., we have developed such a tool which enables the user to zoom in to a particular location, step through all the available maps, print out maps of interest, easily move to another location or zoom back out to the full map extent, and easily link to the project report (which includes all the supporting information on growing the particular crops).
Example maps for New Zealand
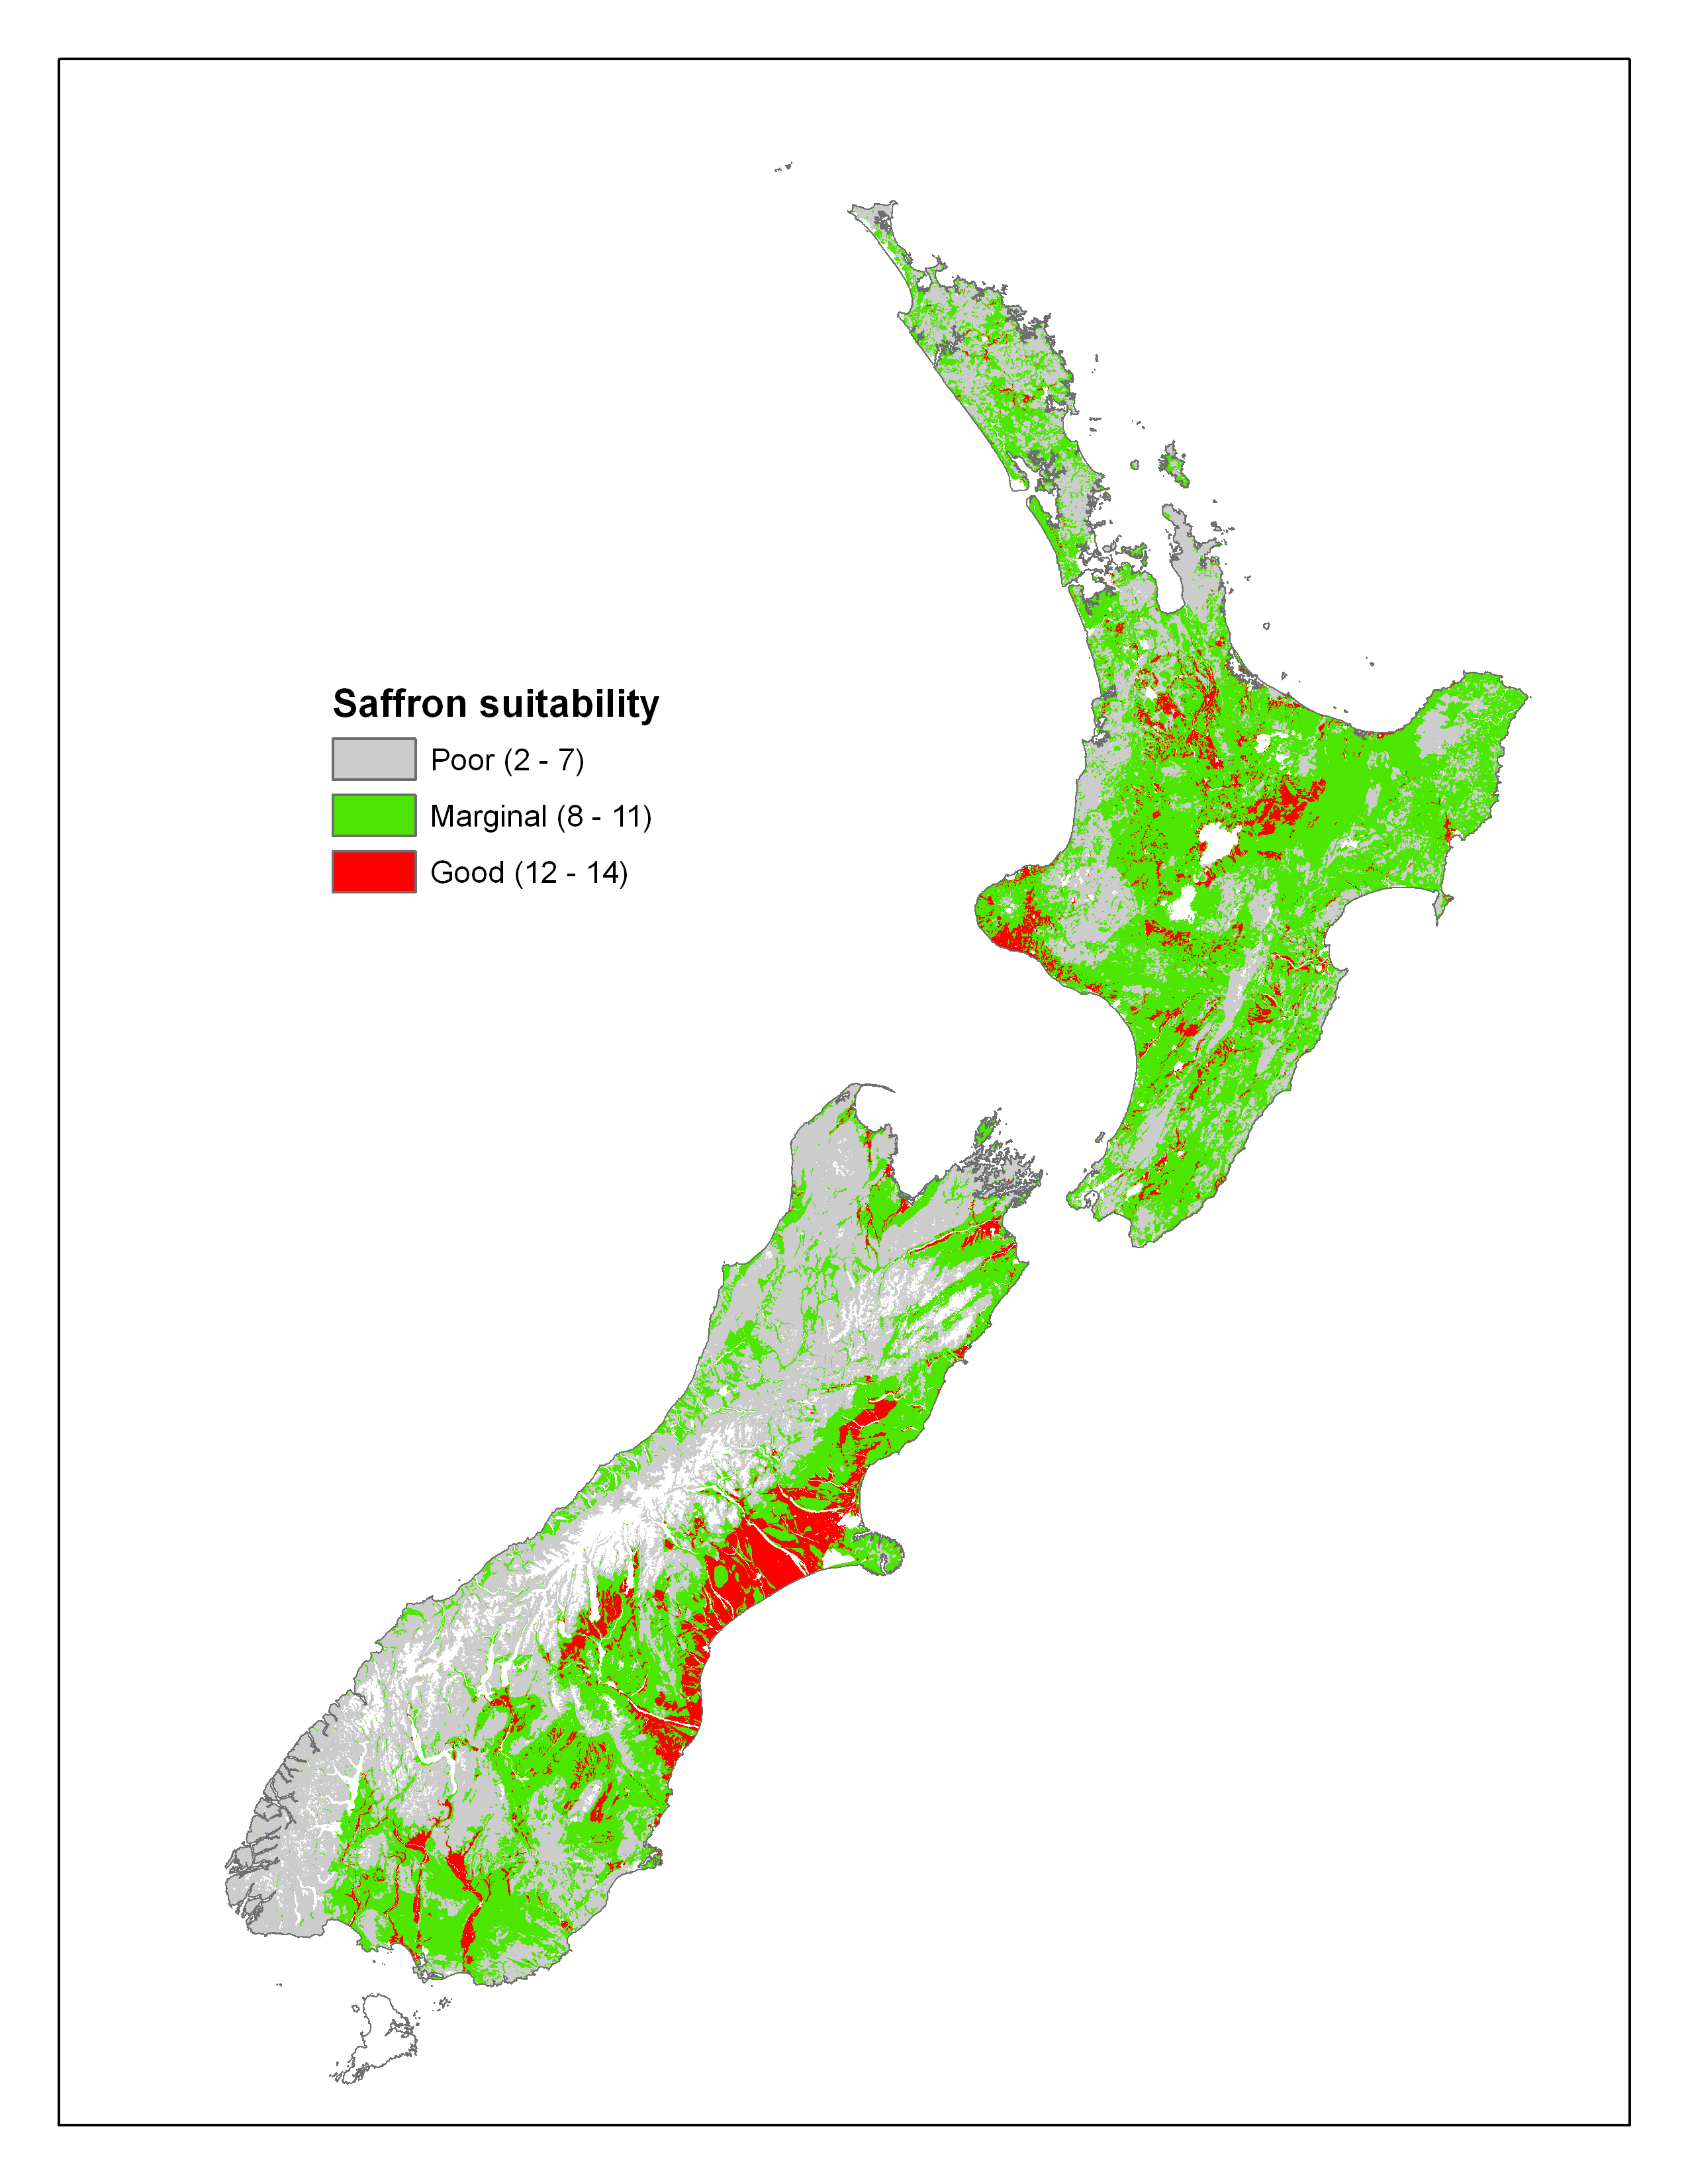
Based on the growing requirement information assembled for the Gisborne, Tararua and Far North projects, together with national GIS climate, soils and topographic datasets, we have produced a set of example growing potential maps for New Zealand.
These maps are indicative only and have been produced with broad suitability classes ("poor", "marginal" and "good"). The suitability index scores (numbers in brackets in the map legend) corresponding to the classes are also shown on the maps . Note, for the tree species maps the Topex variable has not been included in the national analyses. The crop and tree species suitability criteria were derived for specific areas which may not be applicable to all of the country. In addition, there may be other suitability categories specific to an area that have not been taken into account. Thus, these national maps should be viewed as examples of what is possible, and should not be used as the sole basis for landuse change decisions.
For a more detailed crop suitability study for a particular region, look at the Project Plan information on this page for the suggested approach and contact one of the people listed in the Expertise section.
Additionally, the maps shown on the right hand side can be found in the photo gallery below.
View the crop and tree species growing potential photo gallery
Example project plan
The following project plan is suggested to repeat a study like this for any region in New Zealand:
- Identify the crops / tree species that are of interest. This requires:
- Interaction with local people, iwi, councils
- Advice from experts from Plant and Food Research and/or Scion Research
- Suggested mechanism for interaction are community-based workshops and continued dialogue
[Time needed for this stage: 2 months]
- Identify the boundary of the region of interest
- Generate base climate and soil maps for this region, using data from NIWA and Landcare Research
- Identify growth requirement information for each crop or tree species, based on analyses performed by Plant and Food Research and/or Scion Research scientists [Time needed for this stage: 3 months]
- Generate specific climate maps identified in the crop growth requirements analysis. Produce individual maps for each growth limiting factor, and then produce combined suitability maps for each crop / tree species [Time needed for this stage: 1 month]
- Write a detailed report including information on "other factors" which need to be considered when thinking about land-use changes [Time needed for this stage: 2 months]
- Build a map interrogation tool [Time needed for this stage: 4 months]
- Report back to the community
Expertise
The necessary scientific expertise to perform a study of potential crop or tree species suitability for any region of New Zealand lies within the following organisations:
National Institute of Water & Atmospheric Research Ltd (NIWA)
- maintain the national climate database
- have developed climate data interpolation techniques
- provide climate change projections and guidance for New Zealand
- have extensive GIS analysis capability
Plant and Food Research Ltd
- provide expert knowledge on growing requirements of crops grown in New Zealand and overseas
- provide expert guidance for all other aspects of successful cropping.
Scion Research Ltd
- provide expert knowledge on growing requirements of tree species grown in New Zealand and overseas
- provide expert guidance for all other aspects of successful tree cropping.
Landcare Research Ltd
- maintain a national soils database
- provide expert guidance on soil sampling and testing.