Outlook Summary
- El Niño continued during January and has around a 100% chance of persisting through April.
- February is likely to feature weather patterns that are typically associated with El Niño, with episodes of gusty westerly winds. This pattern is expected to produce below normal rainfall in northern and eastern areas of both islands and temperatures that range from cool for the time of year when the air flows from the Southern Ocean to hot with flows from Australia.
- Air pressure is forecast to be above normal to the north of the country and below normal to the south. This is expected to cause more northwesterly quarter winds than normal.
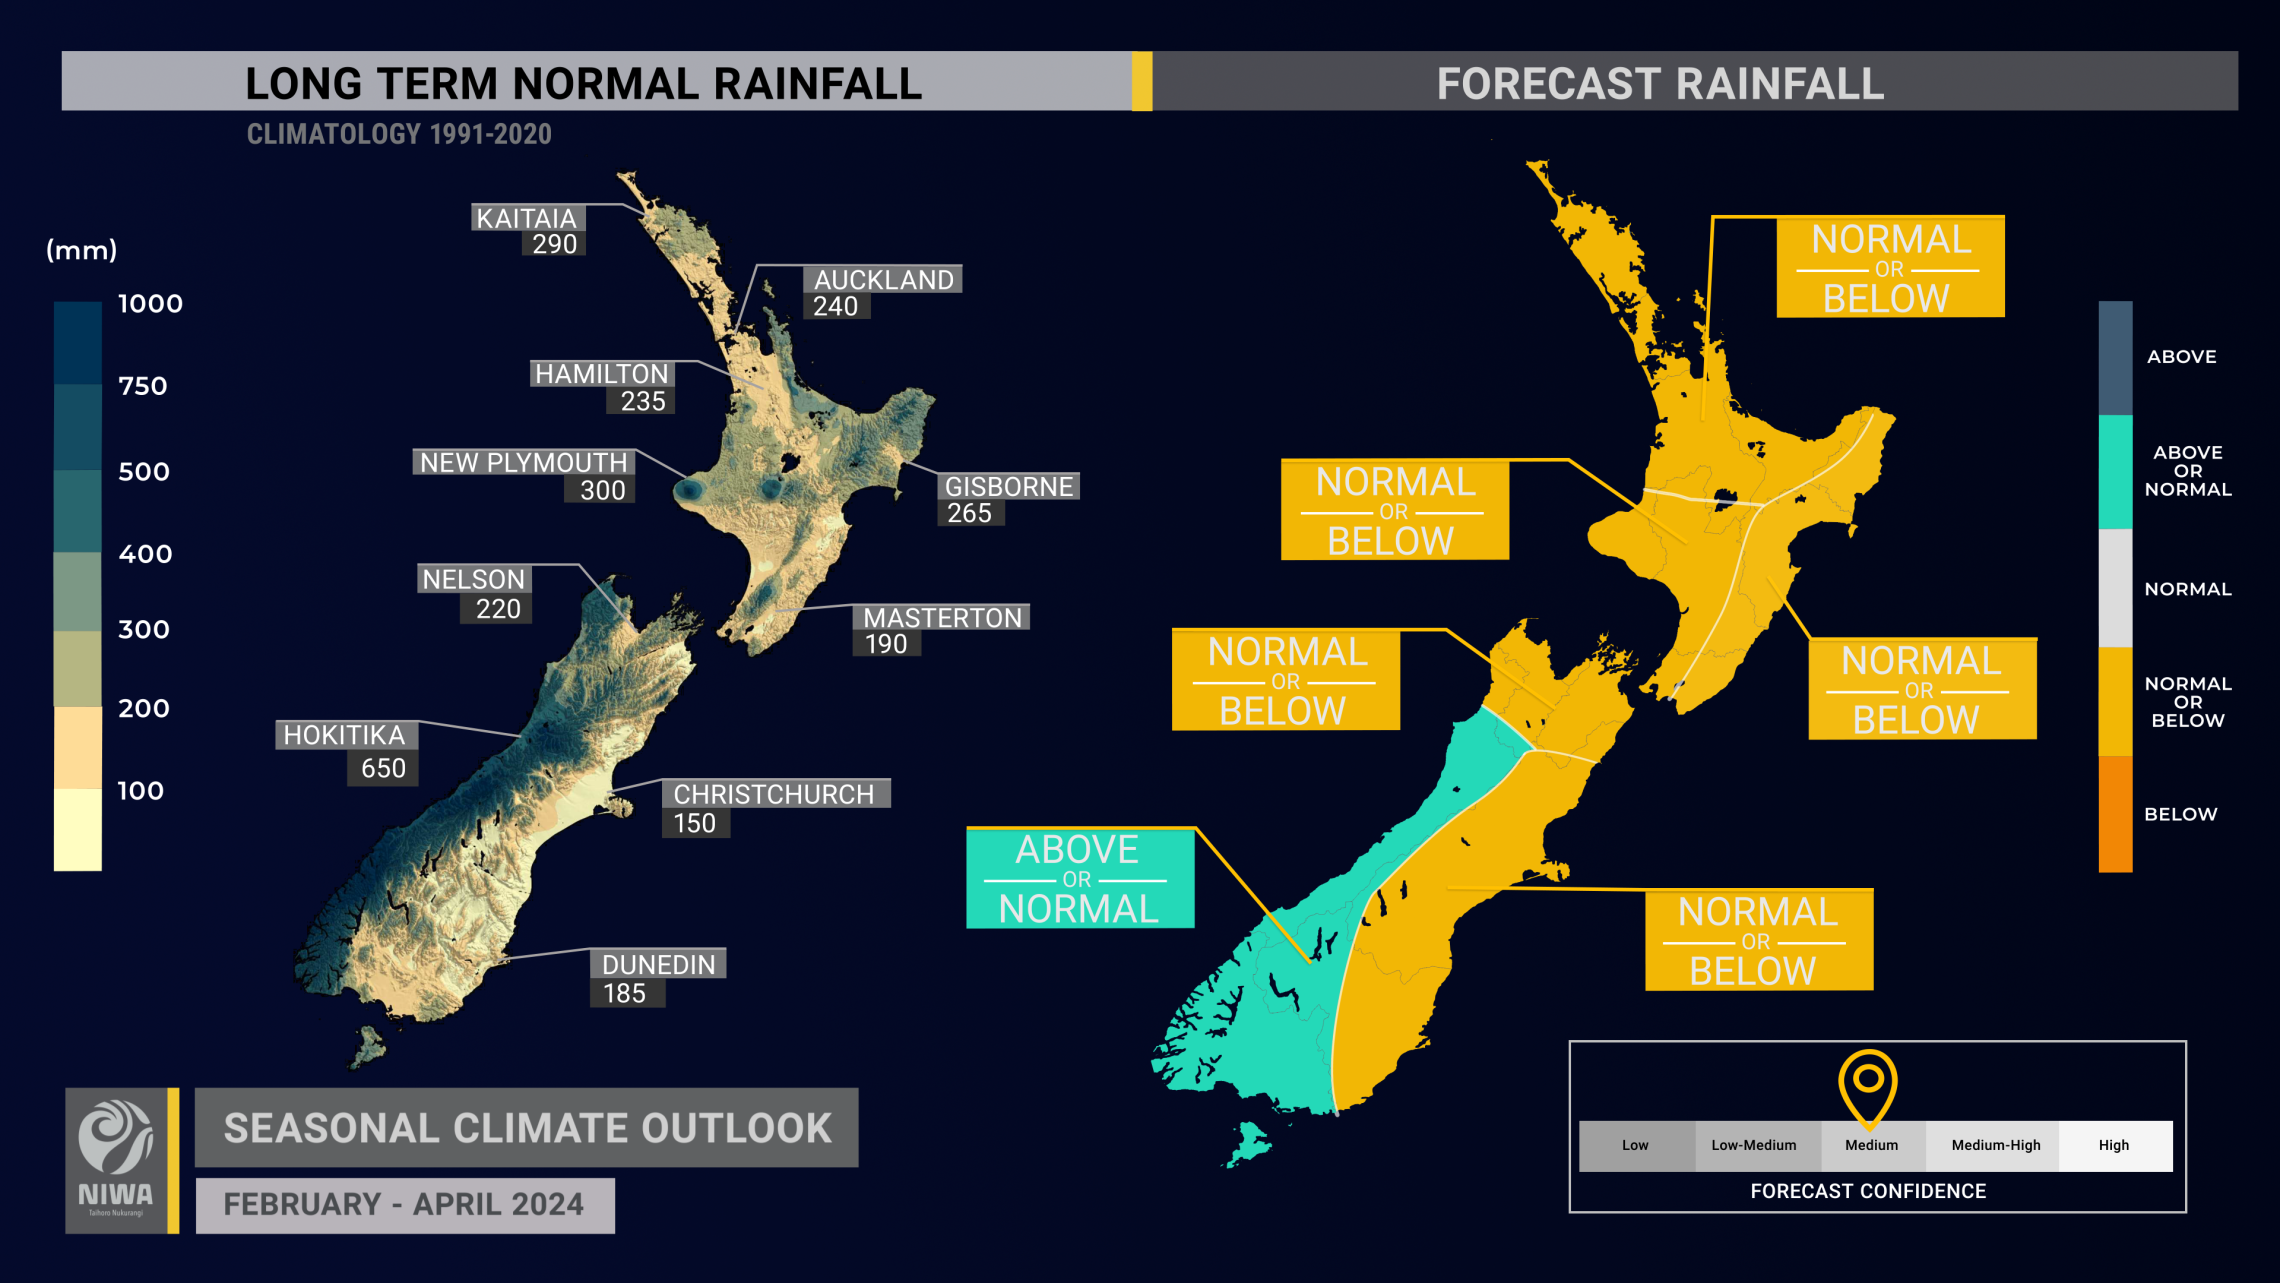
- Rainfall is about equally likely to be near normal or above normal in the west of the South Island and about equally likely to be near normal or below normal in all other regions.
- More variability in rainfall patterns is possible during autumn as El Niño-like forcing gradually wanes, with increased chances for heavy rainfall in the South Island, particularly in the west.
- According to the New Zealand Drought Index, several regions were experiencing unusual dryness as of early February. This may contribute to water restrictions. Climate-sensitive sectors are encouraged to make use of the New Zealand drought dashboard.
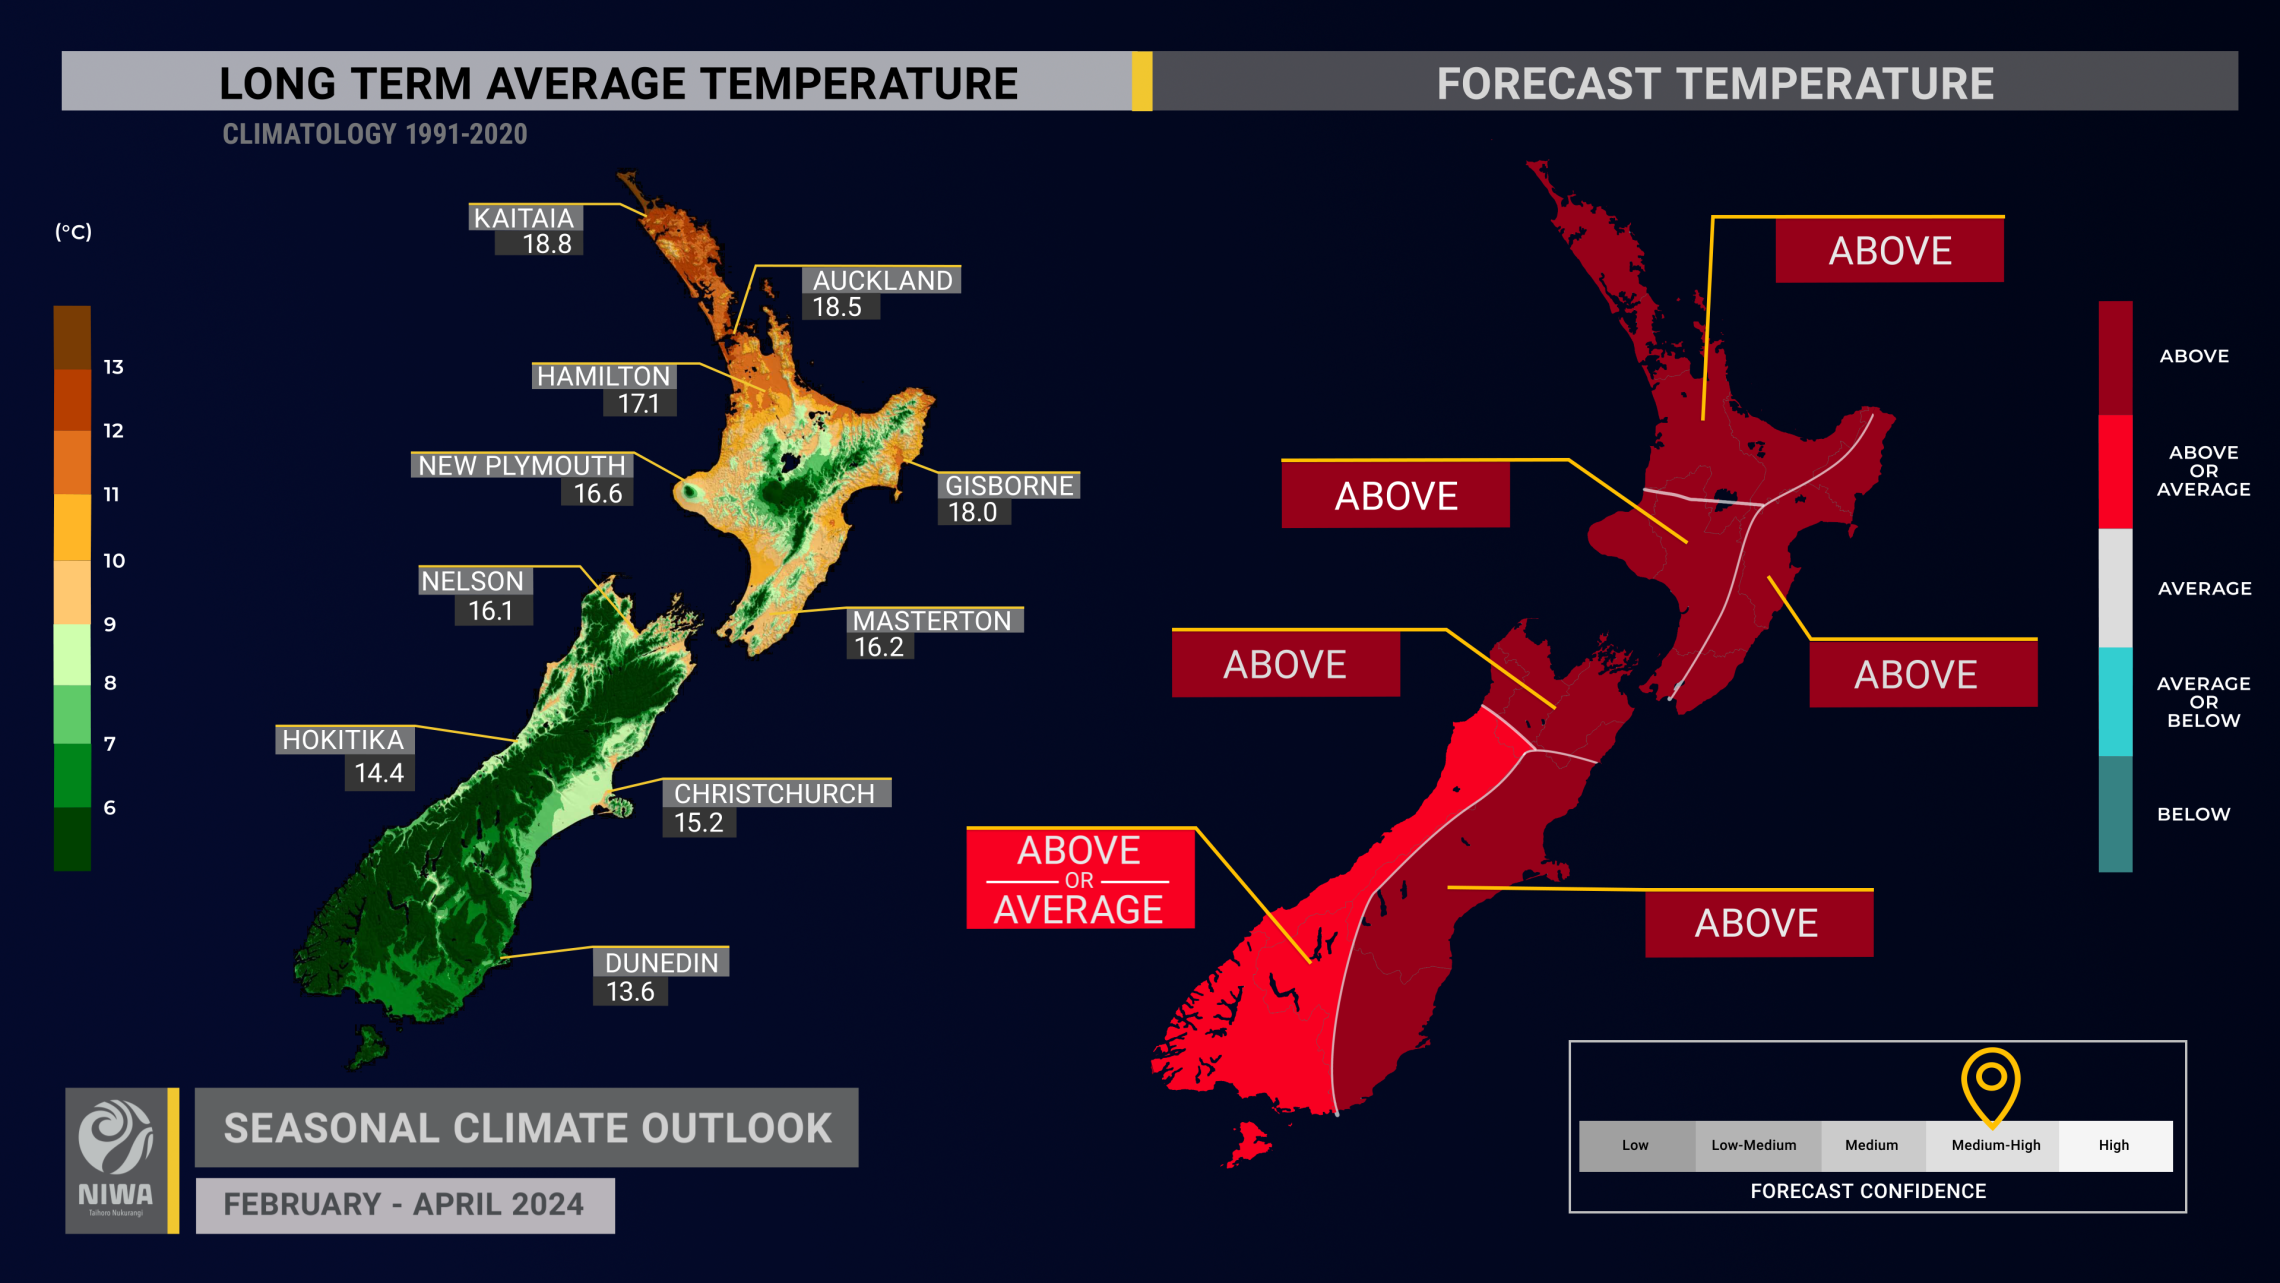
- Temperatures are very likely to be above average in all regions except for the west of the South Island where near average or above average temperatures are about equally likely.
- Wind strength is likely to be above normal in the South Island and lower North Island.
- Coastal sea surface temperatures (SSTs) ranged from 0.65˚C to 2.06˚C above average during January. Marine heatwaves occurred in coastal areas of the North Island and northern and eastern South Island. These are expected to contribute to episodes of above average heat and humidity through the next three months and may increase the level of moisture available to approaching weather systems.
- In the South Pacific, the chance for tropical cyclone activity is elevated during February. While New Zealand has a normal-reduced risk for ex-tropical cyclones this season, an increased level of awareness around cyclone activity is encouraged.
- Soil moisture levels are most likely to be below normal in the east of the South Island and east of the North Island, near normal in the west of the South Island, and about equally likely to be near normal or below normal in all other regions.
- River flows are most likely to be below normal in the east and north of the South Island, about equally likely to be near normal or above normal in the west of the South Island, and about equally likely to be near normal or below normal in the North Island.
- As of early February, fire risk conditions were highest for Otago, Canterbury, and Wairarapa. With dry spells expected in the month ahead, increasing wildfire risk is possible in Wellington, Manawatū-Whanganui, Auckland, and Northland; www.checkitsalright.nz.
Regional predictions for February – April 2024
The tables below show the probabilities (or percent chances) for each of three categories: above average, near average, and below average. In the absence of any forecast guidance there would be an equal likelihood (33% chance) of the outcome for any of the three categories. Forecast information from local and global guidance models is used to indicate the deviation from equal chance that is expected for the coming three-month period. All outlooks are for the three months as a whole. There will inevitably be relatively wet and dry days, and hot and cold days, within a season. The exact range in temperature and rainfall within each of the three categories varies with location and season. However, as a guide, the “near average” or middle category for the temperature predictions includes deviations up to ±0.5°C for the long-term mean, whereas for rainfall the “near normal” category lies between 80 per cent and 120 per cent of the long-term (1991-2020) mean.
Northland, Auckland, Waikato, Bay of Plenty
- Temperatures are very likely to be above average (65% chance). Spells of hot conditions are expected in early February and marine heatwave conditions may enhance warmth through the season.
- Rainfall totals are about equally likely to be below normal (40% chance) or near normal (35% chance). The odds for below normal rainfall are elevated during February. El Niño autumns have historically been associated with reduced rainfall in the region.
- Soil moisture levels and river flows are about equally likely to be below normal (45% chance) or near normal (40% chance).
| Temperature | Rainfall | Soil moisture | River flows | |
| Above average | 65 | 25 | 15 | 15 |
| Near average | 30 | 35 | 40 | 40 |
| Below average | 05 | 40 | 45 | 45 |
Central North Island, Taranaki, Whanganui, Manawatu, Wellington
Probabilities are assigned in three categories: above average, near average, and below average.
- Temperatures are very likely to be above average (65% chance). Marine heatwave conditions may enhance warmth through the season.
- Rainfall totals are about equally likely to be near normal (40% chance) or below normal (35% chance), with February showing elevated odds for below normal rainfall. In autumn, the region may become more exposed to rain-bearing weather systems.
- According to the New Zealand Drought Index, moderate to extremely dry conditions are occurring across parts of the region, which may intensify over at least the next month.
- Wind speeds are expected to be stronger than normal, especially in February.
- Soil moisture levels and river flows are about equally likely to be below normal (40-45% chance) or near normal (40-45% chance).
| Temperature | Rainfall | Soil moisture | River flows | |
| Above average | 65 | 25 | 15 | 15 |
| Near average | 30 | 40 | 45 | 40 |
| Below average | 05 | 35 | 40 | 45 |
Gisborne, Hawke’s Bay, Wairarapa
Probabilities are assigned in three categories: above average, near average, and below average.
- Temperatures are very likely to be above average (65% chance). Spells of hot conditions are expected in early February and marine heatwave conditions may enhance warmth through the season.
- Rainfall totals are about equally likely to be below normal (40% chance) or near normal (35% chance). The odds for below normal rainfall are elevated during February. El Niño autumns have historically been associated with reduced rainfall in parts of the region.
- According to the New Zealand Drought Index, moderate to extremely dry conditions are occurring in southern parts of the region, which may intensify over at least the next month.
- Wind speeds are expected to be stronger than normal, especially in February.
- Soil moisture levels are most likely to be below normal (50% chance) while river flows are about equally likely to be below normal (45% chance) or near normal (40% chance).
| Temperature | Rainfall | Soil moisture | River flows | |
| Above average | 65 | 25 | 15 | 15 |
| Near average | 30 | 35 | 35 | 40 |
| Below average | 05 | 40 | 50 | 45 |
Tasman, Nelson, Marlborough, Buller
Probabilities are assigned in three categories: above average, near average, and below average.
- Temperatures are very likely to be above average (60% chance). Variable temperatures, ranging from autumn-like coolness to well above average heat, are expected in February.
- Rainfall totals are about equally likely to be near normal (40% chance) or below normal (35% chance), with February showing elevated odds for below normal rainfall, particularly in the east. In autumn, the region may become more exposed to rain-bearing weather systems.
- According to the New Zealand Drought Index, very dry conditions and localised meteorological drought is occurring across central and eastern parts of the region, which may intensify over at least the next month.
- Wind speeds are expected to be stronger than normal, especially in February.
- Soil moisture levels are about equally likely to be below normal (45% chance) or near normal (40% chance) while river flows are most likely to be below normal.
| Temperature | Rainfall | Soil moisture | River flows | |
| Above average | 60 | 25 | 15 | 10 |
| Near average | 30 | 40 | 40 | 40 |
| Below average | 10 | 35 | 45 | 50 |
West Coast, Southern Alps and foothills, inland Otago, Southland
Probabilities are assigned in three categories: above average, near average, and below average.
- Temperatures are about equally likely to be above average (45% chance) or near average (40% chance).
- Rainfall totals are about equally likely to be above normal (45% chance) or near normal (40% chance). Occasional strong fronts, lows, and atmospheric rivers may bring heavy rainfall and a chance for flooding, especially in autumn.
- According to the New Zealand Drought Index, moderate to extremely dry conditions are occurring across Otago and the Mackenzie Basin.
- Wind speeds are expected to be stronger than normal, especially in February.
- Soil moisture levels are most likely to be near normal (45% chance) while river flows are about equally likely to be near normal (40% chance) or above normal (35% chance).
| Temperature | Rainfall | Soil moisture | River flows | |
| Above average | 45 | 45 | 30 | 35 |
| Near average | 40 | 40 | 45 | 40 |
| Below average | 15 | 15 | 25 | 25 |
Coastal Canterbury and the nearby plains, east Otago
Probabilities are assigned in three categories: above average, near average, and below average.
- Temperatures are very likely to be above average (60% chance). Variable temperatures, ranging from autumn-like coolness to well above average heat, are expected in February.
- Rainfall totals are about equally likely to be near normal (40% chance) or below normal (35% chance). In autumn, the region may become more exposed to rain-bearing weather systems.
- Periodic wetter than normal conditions may occur when rain bands “spill over” the main divide or during strong southerly changes.
- According to the New Zealand Drought Index, moderate to extremely dry conditions are occurring across the region.
- Wind speeds are expected to be stronger than normal, especially in February.
- Soil moisture levels and river flows are most likely to be below normal (50% chance).
The full probability breakdown is:
| Temperature | Rainfall | Soil moisture | River flows | |
| Above average | 60 | 25 | 10 | 15 |
| Near average | 30 | 40 | 40 | 35 |
| Below average | 10 | 35 | 50 | 50 |
Graphical representation of the regional probabilities
![SCO maps for February - April 2024. [NIWA]](/sites/default/files/styles/wide/public/inline-images/Graphical%20representation%20of%20the%20regional%20probabilities-Feb-April-2024.png?itok=mAr8SE8S)
Background
TheNINO3.4 Index anomaly (which covers the west-central equatorial Pacific) over the last month (through 31 January 2024) was +1.79˚C, within the range of a strong El Niño (classified when the NINO3.4 Index is greater than +1.5˚C). Although the current El Niño event is past its peak oceanic intensity, atmospheric patterns will likely continue to show El Niño-like tendencies in the months ahead.
The Southern Oscillation Index (SOI) was in the neutral range during January (+0.3) and November-January (-0.4). This suggests that El Niño’s reflection in the atmosphere has been atypical, particularly considering the oceanic intensity.
Of the models monitored by NIWA, there’s around a 100% chance of El Niño continuing through April. ENSO neutral conditions are favoured to develop during May-July (around a 65% chance).
Trade wind strengthwas near normal or above normal during January and the expectation for a weakening of the oceanic El Niño verified. A major reversal is forecast during February, with a westerly wind event expected near the equator and off the equator in the South Pacific. This will likely give the ocean-atmosphere system an El Niño-like ‘jolt’, slowing El Niño’s decay. This feature’s influence will ease during March, likely seeing the El Niño weaken further.
The subsurface equatorial Pacific is cooler than average across much of the basin below 100 m depth and the West Pacific is 0.5˚C to 1.5˚C below average near and west of the International Date Line. The east remains warmer than average, with the basin now showing more of a traditional El Niño-like signature, despite the El Niño event now being in its decay stage.
During January,convective forcing focused in the Indian Ocean, Maritime Continent, and western Pacific. Forcing was reduced over the eastern tropical Pacific and Africa. Overall, this configuration was La Niña-like and contributed to intraseasonal variability that was out of sync with El Niño (otherwise known as destructive interference).
As of late January, the Madden-Julian Oscillation (MJO) was active in the West Pacific (phase 7). The MJO is forecast to progress slowly across phase 7 during the first half of February before moving into phase 8 and then possibly phase 1. During March, the MJO shows signs of continuing an eastward progression across the Indian Ocean and potentially into the Maritime Continent.
During February, phase 7 has historically been associated with drier than normal conditions in the North Island and upper half of the South Island. Phase 8 was associated with a wetting trend for the western and lower South Island and parts of the northern North Island. Both phases were associated with temperature variability in the South Island. Across the wider South Pacific, the chance for tropical cyclone activity looks elevated during February. While New Zealand has a normal or reduced risk for ex-tropical cyclone activity this season, an increased level of awareness is encouraged with a higher frequency of cyclone activity in the month ahead.
The possible MJO phase progression of 1-2-3 during March has been associated with above normal rainfall in the western South Island (phases 1-2), above normal rainfall in the northern and eastern North Island (phase 1), and the lower North Island and northern South Island (phase 3). Notably, none of these phases have historically produced above normal rainfall in the eastern South Island. Phases 2-3 also favour below normal rainfall in the eastern North Island.
As far as temperatures go, these MJO phases support variability in the South Island with occasional high heat extremes and Antarctic air masses both possible. Under the same phases, the northern North Island would have the warmest lean of any region.
Perhaps most notably, convective forcing near the International Date Line, which has been a major source of climatic variability over the last year, is expected to wane from February-April. This may mean that New Zealand becomes less exposed to northerly low pressure systems and that westerly winds become more common. Regions that have yet to experience persistent drier-than-normal conditions should remain prepared for that possibility as this change occurs.
Climate-sensitive sectors are encouraged to make use of the New Zealand drought dashboard, which provides 35-day outlooks of rainfall and drought, updated once daily: https://niwa.co.nz/climate/seasonal-climate-outlook
The Southern Annular Mode (SAM) was positive during the first three weeks of January before becoming neutral. The prevalence of high pressure near New Zealand and low pressure in the Southern Ocean during February may yield a near neutral SAM.
A marine heatwave rapidly developed and strengthened during January, with anomalies of +1-3˚C near the North Island and northern and eastern South Island during the month. At the end of the month, the most persistent marine heatwave conditions were found in coastal areas west of Wellington, Manawatu-Whanganui, Taranaki, Waikato, Auckland, Northland, and Bay of Plenty. This feature will likely have an upward influence on air temperatures and humidity in the weeks and months ahead.
For more info, see the NIWA Sea Surface Temperature Update.
| North NI | +1.53˚C |
| West NI | +2.06˚C |
| East NI | +1.38˚C |
| North SI | +1.32˚C |
| West SI | 0.65˚C |
| East SI | +1.31˚C |

Forecast Confidence
Temperature
 | Forecast confidence for temperatures is medium-high. The combination of more northwesterly winds and above average ocean warmth, including regional marine heatwaves, favours above average seasonal temperatures for most regions, with the highest probabilities in the North Island. |
Rainfall
 | A period of El Niño-like climatic variability during February will provide a confidence boost in short-term rainfall patterns, owing to higher confidence in circulation patterns and prevalence of westerly winds. El Niño-like forcing is predicted to wane in March, which leads to a lower confidence outlook at this point. |

