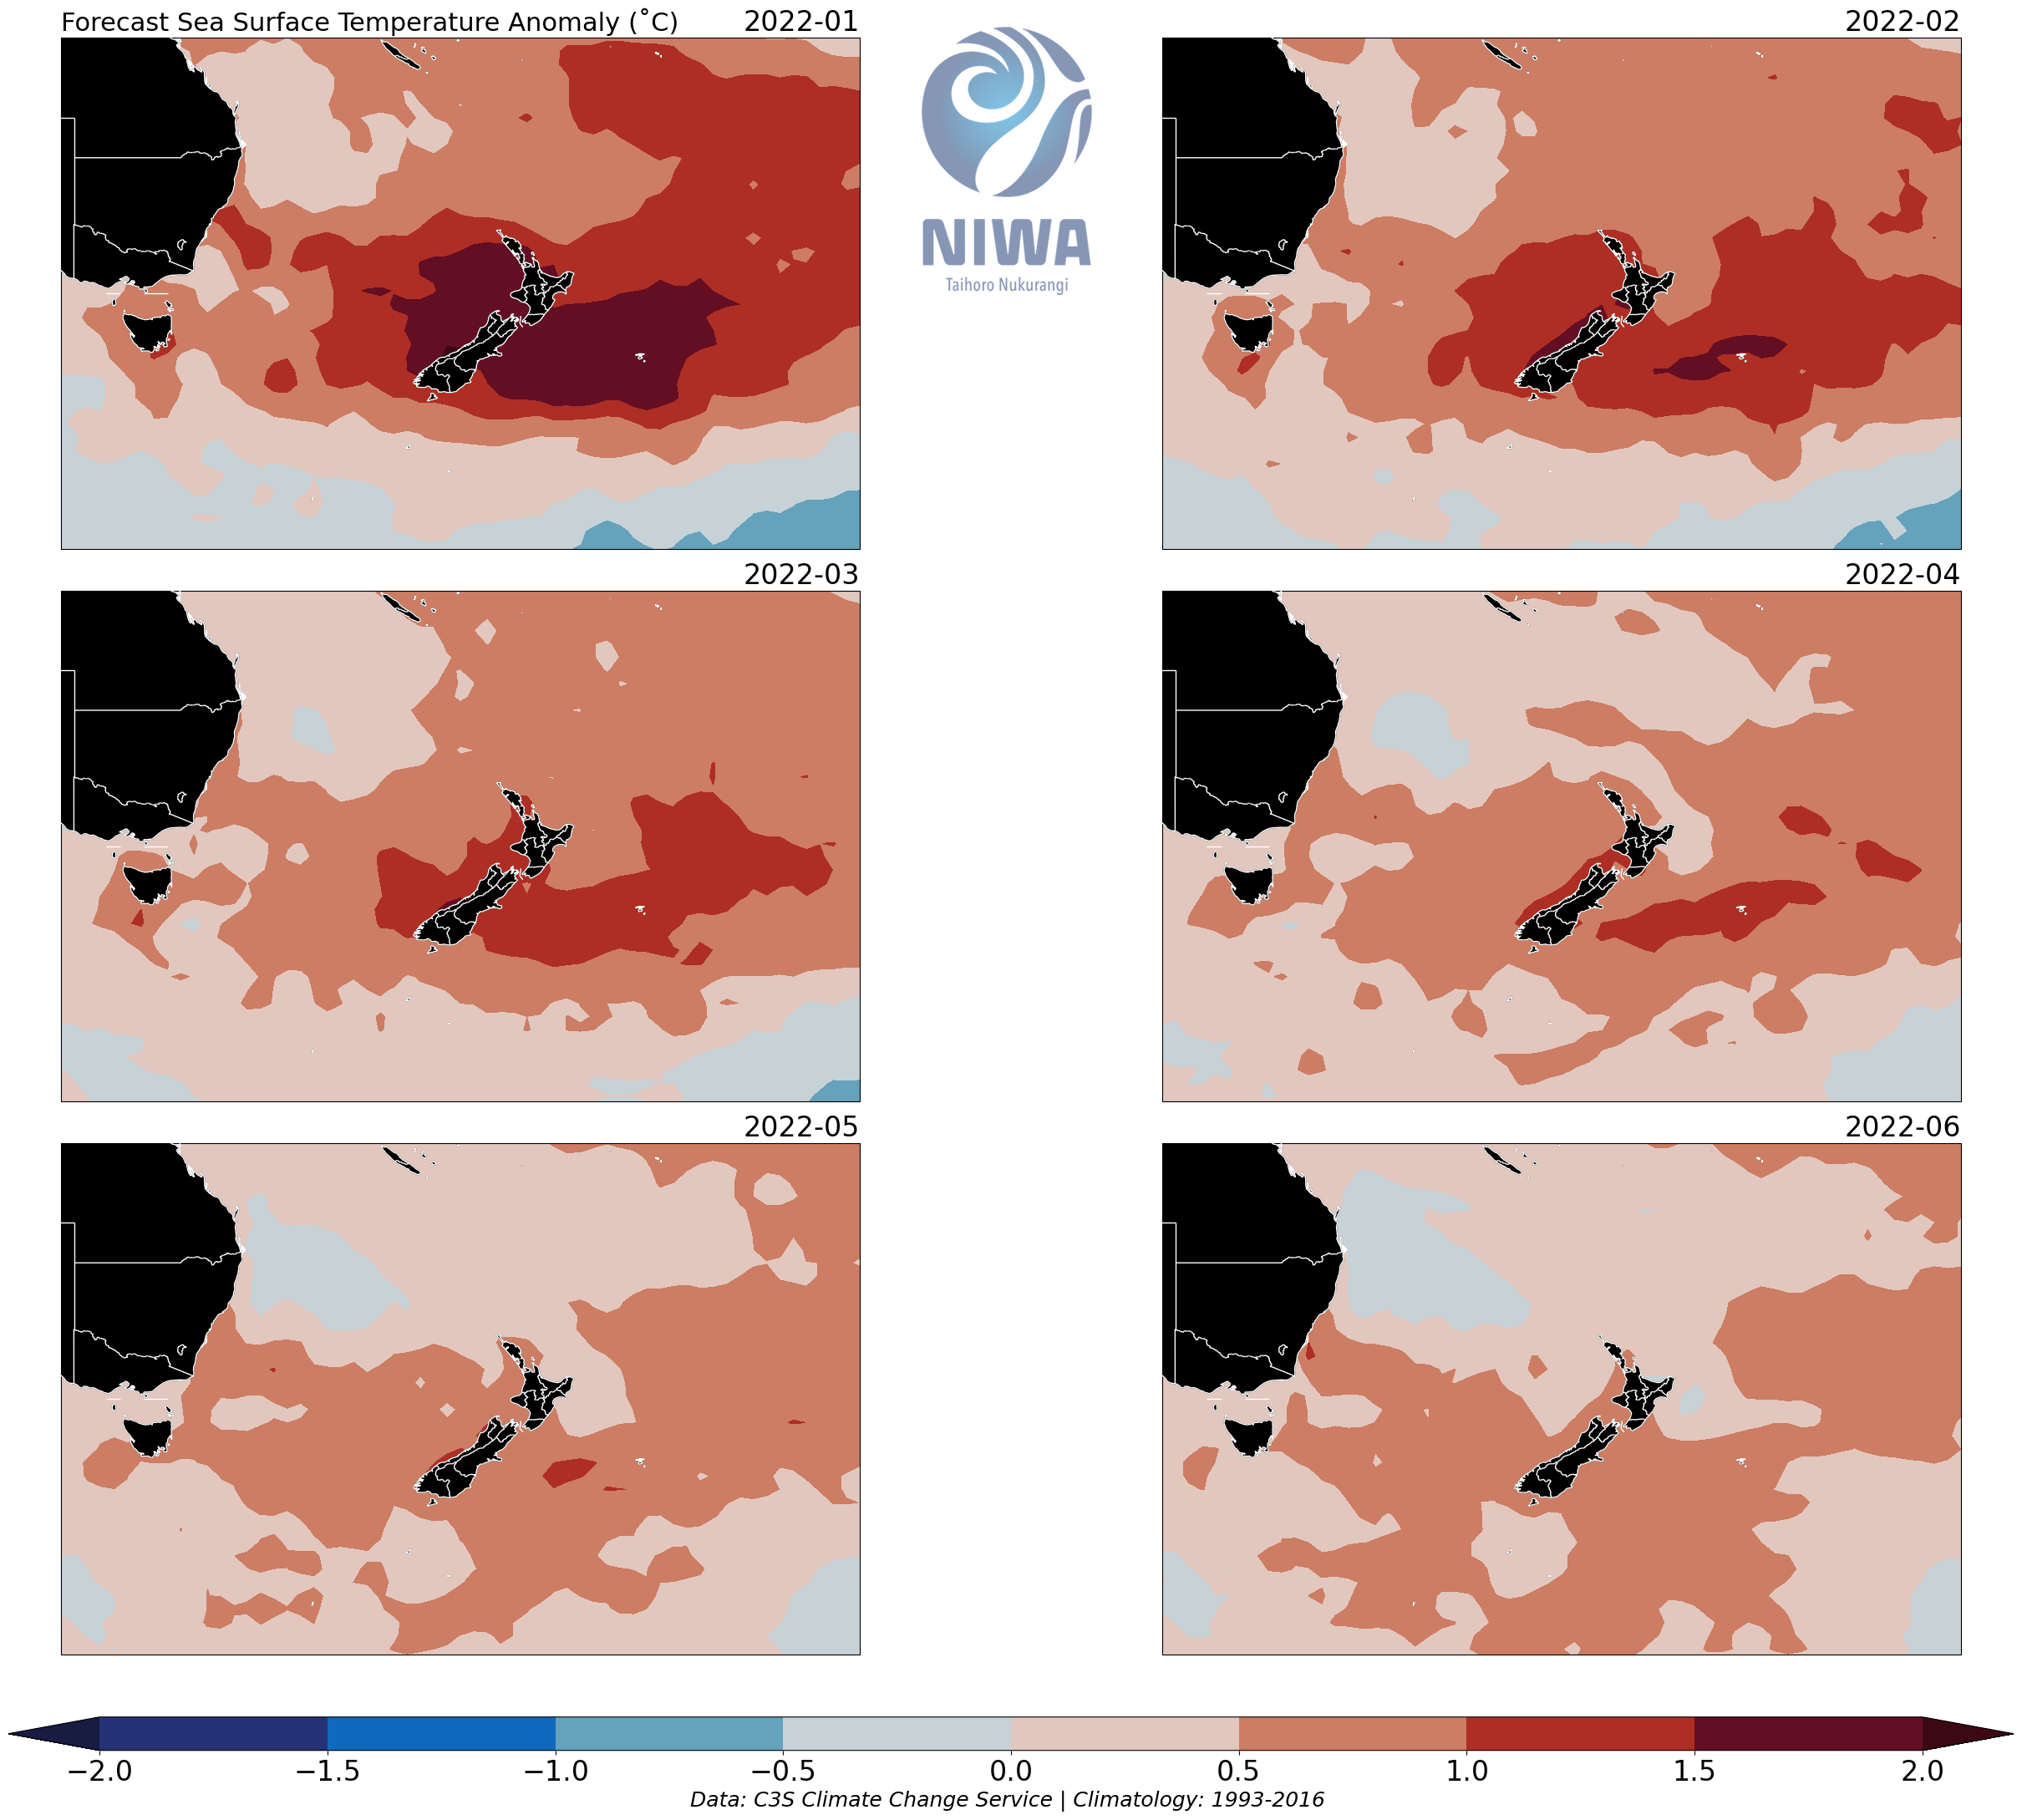
Maps of monthly averaged sea surface temperature anomaly (degrees Celsius) forecasts for the next six months. These maps are created by combining results from 8 different climate models. Regions coloured in red-brown tones are predicted to be warmer than usual. Those in blue tones are predicted to be cooler than usual. Long term averages for each calendar month are based upon the period 1993-2016. They stem from a combination observations stemming from satellites and sensors mounted on drifting floats and other in-situ devices.