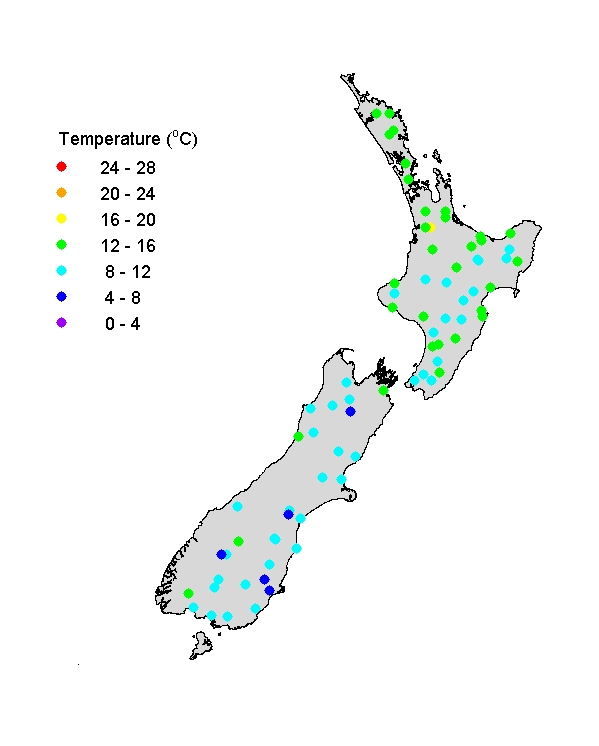
River water temperatures (AMJ)
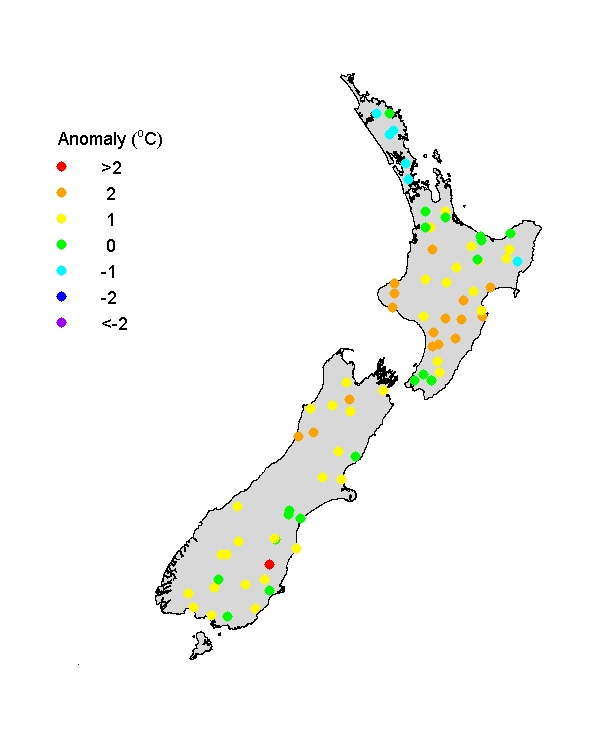
Autumn river water temperatures were mostly in the range 8-16oC in the North Island and 4 to 12oC in the South Island. Weak trends of decreasing temperature moving south (increasingly latitude), and decreasing temperature with increasing altitude (moving into mountainous areas) can be seen. The temperature anomaly map shows that rives temperatures at many sites were higher than normal (1-2oC) for autumn, particularly in central North Island and large parts of South Island probably associated with a sustained dry period and low river flows. Temperatures were somewhat cooler than typical in Northland, weakening the typical latitudinal trend.
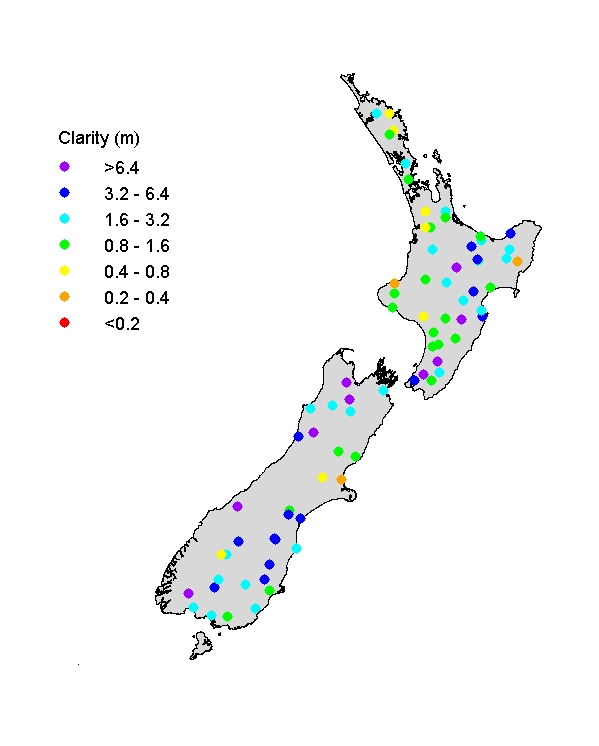
Visual clarity of rivers (AMJ)
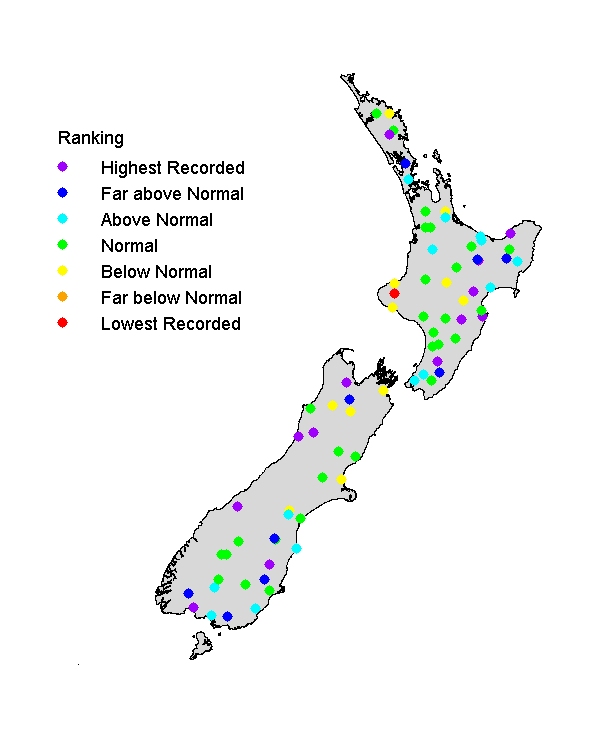
Visual clarity of rivers ranged widely (from <0.2m to >6 m), as is typical. This reflects New Zealand's environmental diversity, particularly soil and rock types and vegetation cover (rivers in forest catchments tend to be clearer than rivers draining livestock pasture). The clarity ranking map shows that many rivers deviated appreciably from typical visual clarity. Numerous rivers were clearer than normal, sometimes markedly so, apparently owing to low flows associated with dry conditions (because visual clarity correlates inversely with flow in rivers). There is little obvious geographical pattern in clarity rankings, apart from a cluster of low average visual clarities in the Taranaki Region.