Defining ENSO Events
Dr Brett Mullan, NIWA
Given the very wide interest in the climate impacts of El Niño-Southern Oscillation (ENSO), it is perhaps surprising that there is no universally accepted definition of an ENSO event. There is certainly qualitative agreement on typical characteristics associated with El Niño and La Niña periods. El Niños are characterised by warmer than normal sea surface temperatures (SSTs) across much of the central and eastern tropical Pacific, weaker easterly trade winds, higher than normal pressures over Indonesia, and an eastward shift in rainfall into the central tropical Pacific. La Niña anomalies are the opposite. Improved observations now allow important sub-surface oceanographic features to be identified too: for example, El Niños have higher than normal sub-surface temperatures in the eastern tropical Pacific, and a deeper thermocline (the boundary between warm well-mixed surface waters and colder deep water).
However, when it comes to a quantitative definition of ENSO, and an unambiguous list of past events, there is no single agreed approach. ENSO events have been identified most commonly using either the Southern Oscillation Index (SOI) or an index of tropical Pacific SST anomaly, usually for either the Nino3 region (5°N-5°S, 90°W-150°W) or the Nino3.4 region (5°N-5°S, 120°W-170°W). Other researchers have suggested bivariate indices (eg, both SOI and SST), and even multivariate indices (by including rainfall and wind anomalies, for example).
Any quantitative definition of an ENSO event requires choices to be made about: (i) What index to use (eg, SOI or Nino3.4) and what smoothing to apply (eg, 3- or 5-month running means); (ii)What threshold value to use (eg, ±1.0 for SOI, ±0.4°C for Nino3.4); (iii)What persistence to require (eg, at least 6 months); (iv)Whether to allow short-lived exceptions (eg, index dips below threshold for one or two months within an ENSO sequence).
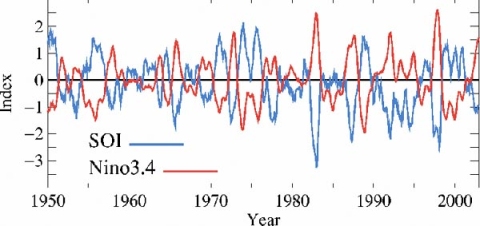
Figure shows time series of both the SOI (normalised Tahiti minus Darwin pressure difference) and Nino3.4 (using Reynolds SST, 1982-2002, concatenated to UKMO HadISST1.1, and normalised relative to 1971-2000). Visually the curves seem almost mirror images of each other, although the correlation coefficient is only –0.89. There are differences in the detail, such as the 1977/78 El Niño being much stronger in the SOI data.
There is a recent initiative by NOAA to obtain international agreement on an operational definition of El Niño and La Niña events. Although a number of the typical ENSO characteristics (above) could be incorporated, NOAA has chosen to use the simple Nino3.4 index with minimum smoothing in time. ( www.noaanews.noaa.gov/stories/s2095.htm) For research purposes, the use of an SST index (Nino3.4) is now the most common method for defining ENSO, at least for events from about 1950 and later. The SOI is still preferred for events earlier in the historical record. The Table below lists ENSO seasons based on the Nino3.4 5-month running mean SST exceeding ±0.4°C for at least 6 consecutive months (a definition that is gaining acceptance).
Table 1. ENSO seasons (eg, “52” is 1952, associated with the January year), based on Nino3.4 index as defined in text. Bolded years also have the seasonal mean SOI exceeding ±1.0. The italicised 1953 El Niño does not quite reach the SST threshold, but is commonly accepted as an El Niño event in the literature.
| Event | Season | Years (century number omitted) |
|---|---|---|
| El Nino | Dec-Feb | 52, 58, 64, 66, 69, 70, 73, 77, 78, 83, 87, 88, 92, 95, 98, 03 |
| Mar-May | 53, 66, 69, 77, 83, 87, 91, 92, 93, 97, 98 | |
| Jun-Aug | 51, 53, 57, 63, 65, 69, 72, 77, 82, 87, 91, 93, 94, 97, 02 | |
| Sep-Nov | 51, 57, 63, 65, 69, 72, 76, 77, 82, 86, 87, 91, 94, 97, 02 | |
| La Nina | Dec-Feb | 50, 51, 55, 56, 57, 65, 71, 74, 76, 84, 85, 89, 96, 99, 00 ,01 |
| Mar-May | 50, 55, 56, 71, 74, 75, 85, 89, 99, 00 | |
| Jun-Aug | 50, 54, 55, 56, 64, 71, 73, 74, 75, 88, 98, 99 | |
| Sep-Nov | 50, 54, 55, 56, 64, 70, 71, 73, 74, 75, 83, 84, 88, 95, 98, 99, 00 |
Figure 1 Five-month running mean of Southern Oscillation Index (SOI) and Nino3.4 SST anomaly, Jan-1950 to Dec-2002.