NIWA answers a wide range of scientific questions using ocean modelling. These models can be linked to well established weather forecasting models to predict ocean temperature, sea level and the dispersal of pollution.
The ocean around New Zealand
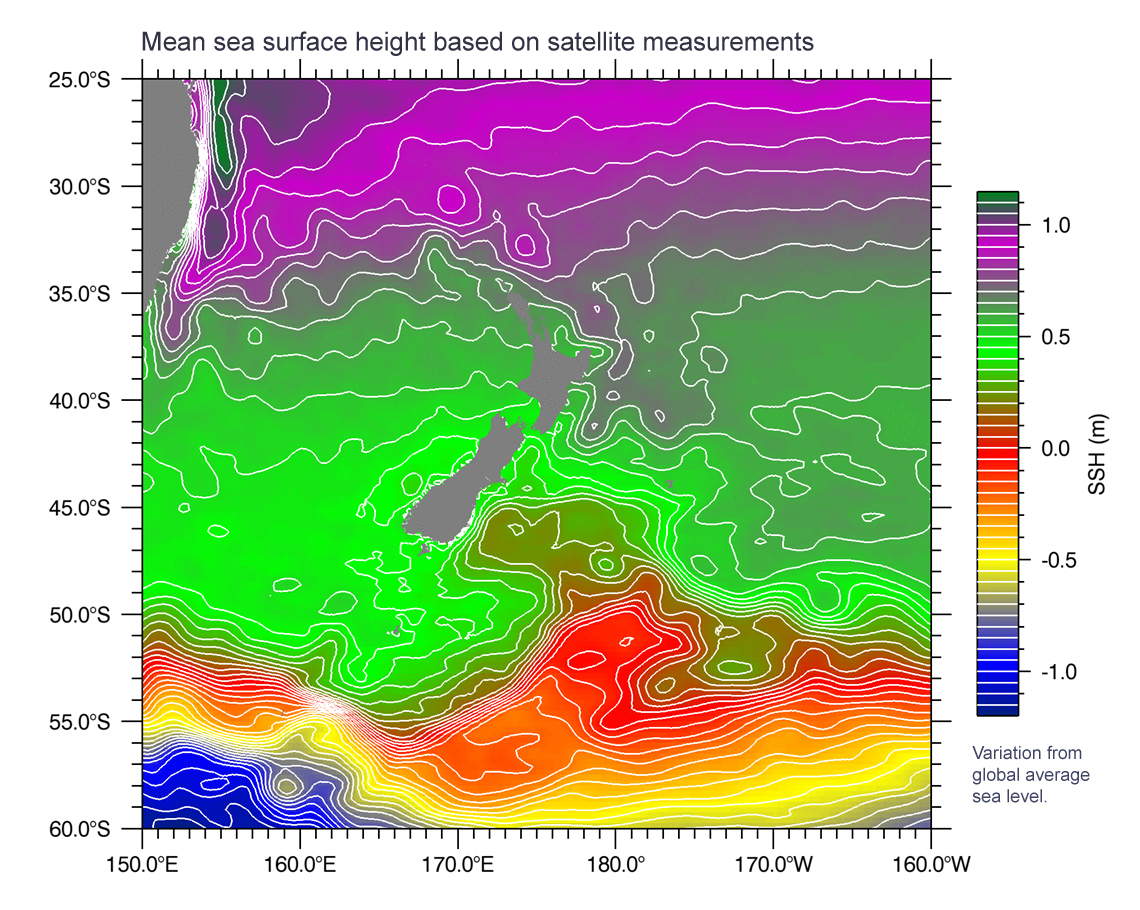
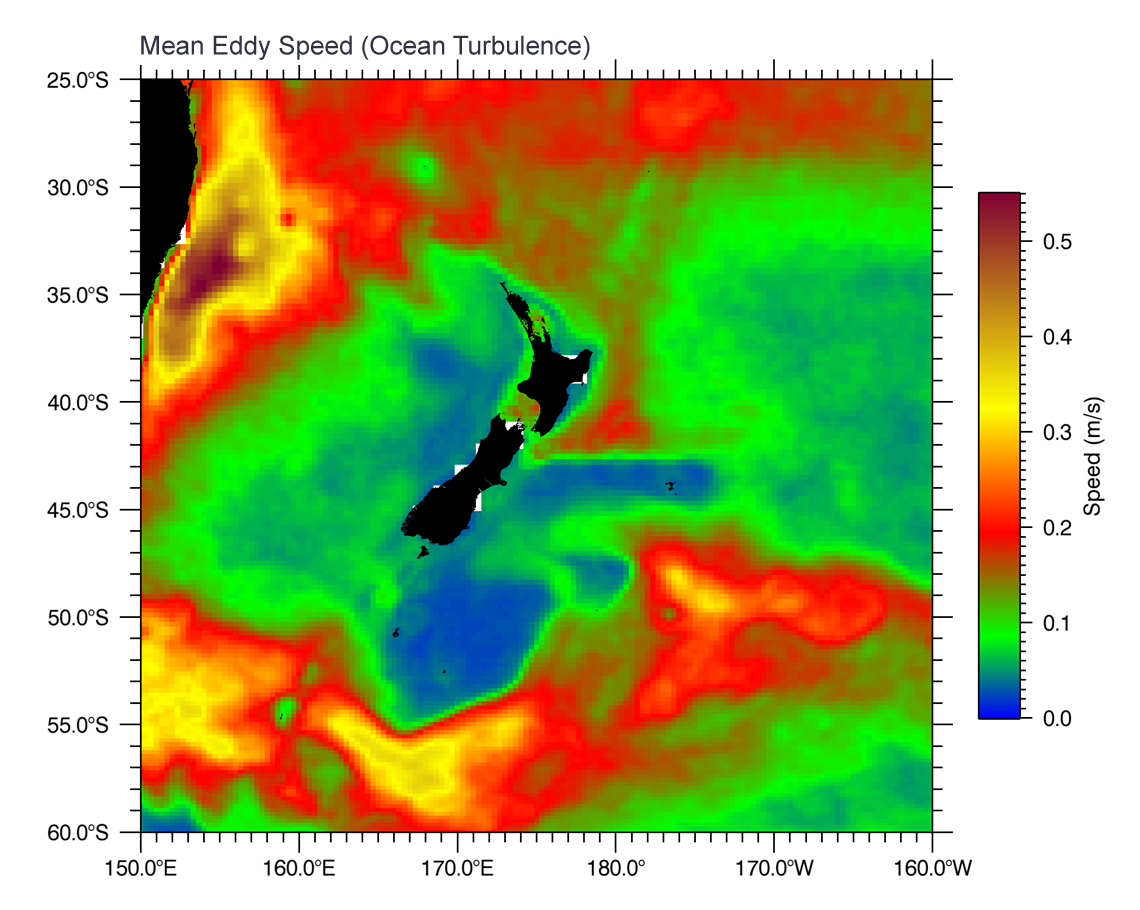
Our knowledge of the ocean environment around New Zealand continues to grow. The depth of the sea floor, or bathymetry, has been mapped by equipment on our RV Tangaroa. Sea level, currents and turbulence are measured by many different satellite instruments, the results of which are backed up by measurements by autonomous Argo floats, thousands of which are drifting and recording data as part of an international programme, and by ship-board measurements. You can see examples of this information on the right, which is often used as the starting point for mathematical numerical simulations (modelling).
More information on RV Tangaroa's multibeam swath mapping system

How to model the ocean
Modelling the ocean is very a complex task, particularly given the large scales and the equations we need to solve. One way to solve this mathematical problem is to divide the ocean volume up into a large number of separate boxes, as part of a grid. The calculations for temperature, momentum, pressure and so forth are performed for each box for each step of a model, and the results are used as the inputs for the calculations in the boxes that are connected to it for the next step.
As the size of the boxes compared to the area being modelled reduces, the models start to do a better job of many processes that are observed in nature, such as eddies, instability, and turbulence.
At any instance the state of the ocean (and its representation in the model) is determined by the initial conditions, and then the processes that change the state of the ocean (forcings). Examples of such forcings are the sea floor depth, atmospheric pressure, freshwater input, heating (from the sun), and wind.
The inputs for boxes at the edge of the area modelled are known as boundary conditions, and are usually based upon a larger, global model at lower resolution (bigger boxes) or calculated from observed climate data.
One of the oceanic modelling tools use in NIWA is the Regional Ocean Modelling System (ROMS), an open source program created by an international collaboration of many institutions and researchers.
New Zealand regional modelling
The scale of the grid used varies depending upon the size of the area studied. The full NZ region is around 2000 km across and uses a grid size of around 10 km. Coastal models look at regions 10 to 100km across, and use grid spacing down to 500m, or smaller. You can see two examples of the model areas (or domains) used in our research on the right. The videos below show the result of simulations performed in some of these domains.
Applications
Ocean modelling can be useful for understanding:
- Larval dispersal
- Freshwater transport: water quality, suspended sediment
- Estimating current speed statistics for petroleum exploration
- Sediment plume modelling for offshore mining
- Aquaculture: benthic deposition; nutrient transport
Example model animations
The video above shows a model of temperature at a depth of 500m, simulated over 5 years using the Regional Ocean Modelling System (ROMS).
The video above is from a model of sea surface temperature off the south island coast over one year, using the Regional Ocean Modelling System (ROMS).
The video above is from a ROMS model of surface freshwater concentration along the South Island coast, over a time period of one year. Notice the river mouths supplying the freshwater, and the red arrow showing wind direction.