New Zealand temperature trends from a set of eleven climate stations with no significant site changes since the 1930s
What is the eleven-station series?
We have identified from the NIWA climate archive a set of eleven stations spanning New Zealand in which there has been no significant site moves for many decades. For six of these stations these records go back to at least the 1930s.
The sites are Raoul Island, Tauranga Airport, Ruakura (Hamilton), Gisborne Airport, Chateau Tongariro, Palmerston North DSIR/AgResearch, Westport Airport, Molesworth, Queenstown, Invercargill Airport and Campbell Island.
The warming trend over the 77 year period of this series is close to 1°C
We have analysed raw data from these sites directly, making no adjustments to the numbers from the NIWA climate database. Taking all sites together and averaging the annual mean temperatures anomalies (difference from 1961–90 mean at each site) results in Figure 1 below.
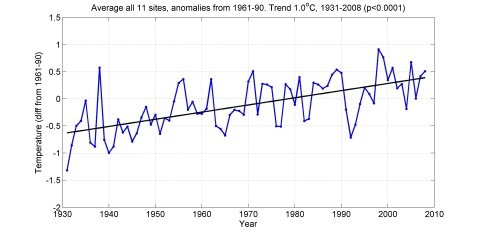
Figure 1: Temperature departures from the 1961–90 normal, averaged over the eleven sites listed in Table 1. For years where not all sites are available, the average is over those that do have records.
Note that not all stations have annual mean temperature values for all years in 1931–2008. It is common practice to in-fill isolated missing months, but we have deliberately not in-filled missing data here to keep this analysis as non-contentious as possible. For each year, the available station values have been averaged. In the title of the Figure, the “p-value” comes from a statistical test, and indicates the probability that the indicated trend could have arisen by chance.
If the two outlying Island records (Raoul and Campbell Islands) are left out, and the anomalies for the remaining nine records averaged, the result is as shown in Figure 2. In either case, the trend over the 77 year period is close to 1°C.
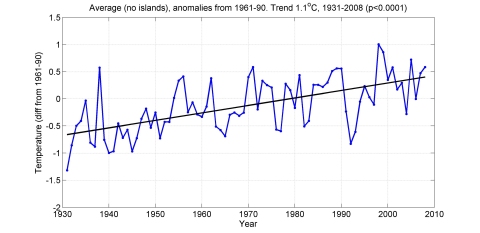
Figure 2: Temperature departures from the 1961–90 normal, averaged over the nine sites listed in Table 1 that are located on the main islands of New Zealand (i.e., all but Raoul and Campbell Islands). For years where not all sites are available, the average is over those that do have records.
This analysis was completed by:
- Dr Jim Salinger, Honorary Research Fellow, School of Environment, University of Auckland
- Dr James Renwick, Principal Scientist, Climate, NIWA Wellington
Detail of the eleven-station series
Below is a table of station names, and the associated network and agent numbers that make up the record for each site.
A link to a spreadsheet of the data (annual anomalies) for this series is at the bottom of this webpage.
Note that while these sites have had no significant moves since the 1930s, their records may be stored in the climate database under more than one network or agent number. This is because the database archiving procedures take account of such things as a change from a manual recording system to an automated recording system. Also, some sites have records going back before 1930, but it’s the period from 1931 where all of these sites are unaffected by significant site changes.
Table 1: List of stations with long-term records where no significant site changes have occurred.
| Station name | Network numbers | Agent numbers | Period | Remarks |
|---|---|---|---|---|
| Raoul Is | J99700 J99701 | 6169 6170 | Apr 1940 – Oct 1998 Dec 1991 – present | Automation of site |
| Tauranga Aero | B76621 B76624 | 1612 1615 | Feb 1913 – Feb 1989 Jun 1990 – present | Automation of site |
| Hamilton, Ruakura | C75731 C75733 C75734 | 2101 12616 26117 | Nov 1906 – Feb 1997 Nov 1996 – Feb 2007 Dec 2005 – present | Automation of site Small site shift |
| Gisborne Aero/AWS | D87692 D87695 | 2807 2810 | Apr 1937 – Feb 1993 Jan 1990 – present | Automation of site |
| Mt Ruapehu, Chateau | C95251 C95152 C95153 | 2363 2357 18464 | Jan 1930 – Feb 1983 Mar 1981 – Oct 2000 Oct 2000 – present | Small site shift Automation of site |
| Palmerston N | E05363 E0536D | 3238 21963 | Jan 1928 – May 2001 Apr 2001 – present | Automation of site |
| Westport Aero | F11752 F11754 | 3810 7342 | Mar 1937 – Oct 1991 Nov 1991 – present | Automation of site |
| Molesworth | G23021 G23022 | 4461 7427 | Mar 1944 – Oct 1992 May 1992 – Jul 1994 | Automation of site |
| Queenstown | I58061 | 5446 | Nov 1929 – present | |
| Invercargill Aero | I68433 | 5814 | Jun 1948 – present | |
| Campbell Is | K94400 K94402 | 6172 6174 | Jul 1941 – Aug 1995 Dec 1991 – present | Automation of site |
Download the data here
The data for these sites reside on the publicly-accessible national climate database operated by NIWA - DataHub. For even easier access, we have posted an excel spreadsheet of the data. Note that this data set is no longer being updated.
See an explanation of how "missing data" are dealt with for this temperature series
Data may be missing for a variety of reasons, for example when an instrument malfunctions or a person fails to record the measurements or a measuring site closes.
-

Technical note on the treatment of missing data in the 11-station series
In climate science, there are a number of accepted methods to account for missing data in temperature series.