Water resources in autumn 2003
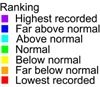
River flow
River flows in autumn were far below normal in most of New Zealand, except in Northland and Gisborne, where they were well above normal. There were extremely low flows in March and April in Wellington, Marlborough, Otago, West Coast, and Southland. Most rivers began to recover in May.

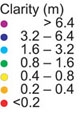
Water clarity
Streams were much clearer than usual for this time of year in the southern North Island and lower South Island, as a result of the low flows, with very few floods to stir up river sediments. The flood-affected rivers of Northland and Gisborne were much murkier than usual.


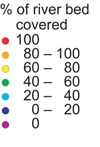
Slime index
Maximum values of the slime index were generally low this autumn. The slime index records the cover of the bed by ‘nuisance’ slimes (algae growing as thick mats or filamentous growths) that reduce the recreational and aesthetic value of the river if too prolific (i.e., cover > 30–60%). Slimes are encouraged by warm temperatures, sunlight, nutrients (especially nitrogen and phosphorus), and lack of floods.

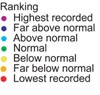
Water temperatures
Stream temperatures were near to normal in autumn for most of the country, except in Canterbury, Buller, Taranaki, and Gisborne, where they were higher than normal.


Lake levels
Lake levels across New Zealand were well below normal for the time of year in the South Island, and close to normal in the North Island. For many lakes, the levels are a reflection of recent weather. However, for lakes that are managed for uses such as hydroelectric power generation or irrigation, the levels are influenced by how the lake is managed, depending on the timing of inflows, the patterns of demand for water, and the operating rules for managed lakes.

This page summarises a variety of water resources data for the period March to May 2003. Note that the data are preliminary, and subject to amendment after quality assurance procedures. We thank NIWA field teams, regional and district councils and hydro-power companies for providing this information. We hope to expand the coverage with contributed measurements using standard methods at long-term sites.
For information on hydroelectricity storages, see COMIT Free To Air.
Groundwater
The groundwater indicator wells suggest low groundwater levels for the season throughout most of the country, except for the north and east of the North Island, where they were average. The northern and eastern regions have increased seasonal groundwater levels compared with the Dec–Feb 2003 levels. All other regions remained at a similar level to the previous period. Heavy rain in March in the northern and eastern North Island regions was responsible for the increased levels, whereas below-average rainfall for the rest of the country over this period has done little to replenish the groundwater aquifers.

Groundwater information is supplied by the Institute of Geological and Nuclear Sciences Ltd.