A look at river flows over the last three-month period
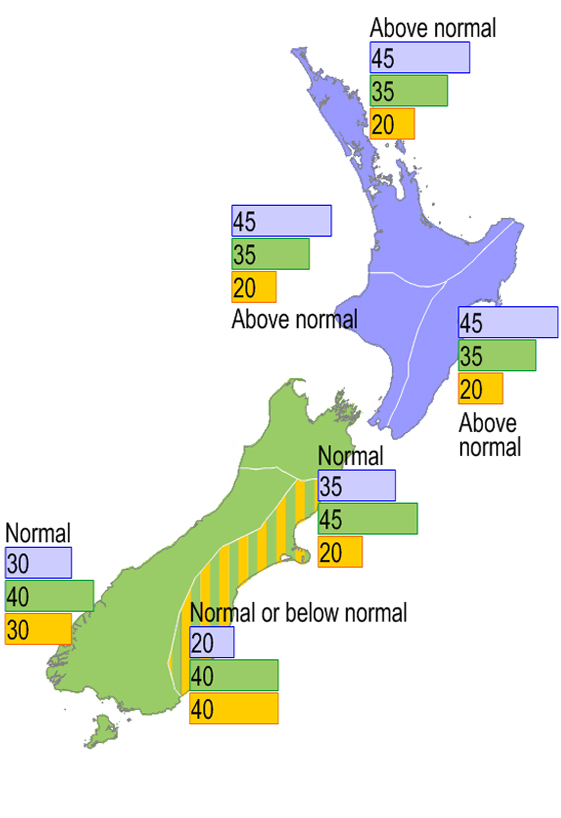
What we predicted for February to April 2011
River flows were predicted to be above normal in the North Island, normal in the north, west and south of the South Island, and normal or below normal in the east of the South Island.
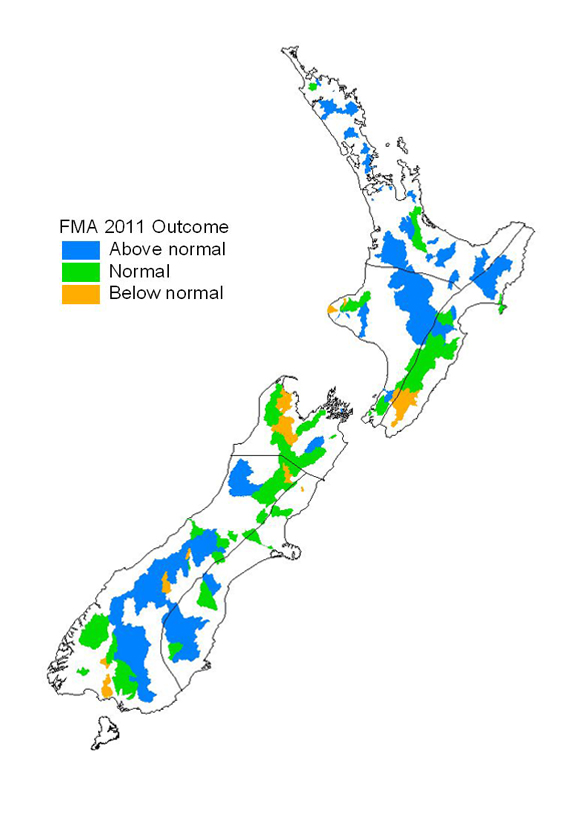
What actually happened, February to April 2011
River flows were above normal in the central and northern North Island and in the South Canterbury and Otago headwaters and eastern Southland. Wairarapa and parts of Tasman were below normal, and other parts of the country had normal river flows.
Interpreting these maps
Percentage chance of above normal, normal or below normal flows.
Mapped quantities for the past month, and the past three months, are based on the position of those flows in a distribution of historical flows from each flow recorder for that month or that season. (A season is any contiguous three-month period). At present the data used to estimate the distribution are flow data from the beginning of each flow record up to the year 2000.
If a catchment is mapped as 'normal' this means that the flows for the period were in the middle tercile (third) of the historic distribution. Catchments mapped as 'far below' or 'far above' normal mean that their flows for the period correspond to the bottom or top 10% of the historic distribution. Catchments mapped as 'below' or 'above' normal had their flows respectively in the bottom or top tercile but not in the most extreme 10% of historic flows.