Climate developments in July 2006

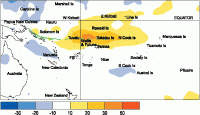
During July, the SPCZ was weaker than average, with most of its activity being near the Solomon Islands. The SPCZ was fairly inactive east of the Date Line. There were weak regions of enhanced convection between Papua New Guinea and Vanuatu, and also near the Southern Cook Islands. Rainfall was between 250 and 325% of average in the Southern Cook Islands and parts of central and southern French Polynesia.
A region of suppressed convection affected Tuvalu, Tokelau, and the Northern Cook Islands. Rainfall was 50% or less of average throughout much of New Caledonia.
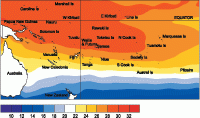
Mean air temperatures were 1.0 °C or more above average in much of Tuvalu, and parts of central and southern French Polynesia. In contrast, they were at least 0.5 °C below average throughout much of New Caledonia, and more than 1.0 °C below average in parts of Fiji.
Tropical Southwest Pacific mean sea-level pressures were above average in the Tasman Sea, near average near the Date Line, and below average over the Southern Cook Islands. Equatorial surface easterlies occurred in 60% of observations at Tarawa, the lowest frequency of occurrence there since 55% in February 2005.
| Country | Location | Rainfall (mm) | % of average | Comments |
|---|---|---|---|---|
| Cook Islands | Rarotonga Airport | 335 | 322 | Record high |
| French Polynesia | Tahiti – Faaa | 161 | 303 | Well above average |
| French Polynesia | Rapa | 637 | 253 | Record high |
| New Caledonia | Koumac | 6 | 12 | Extremely low |
Soil moisture in July 2006

Estimates of soil moisture shown in the map (above) are based on monthly rainfall for one station in each country. Currently there are not many sites in the water balance model. It is planned to include more stations in the future.
The information displayed is based on a simple water balance technique to determine soil moisture levels. Addition of moisture to available water already in the soil comes from rainfall with losses via evapotranspiration. Monthly rainfall and evapotranspiration are used to determine the soil moisture level and its changes.
Please note that these soil moisture calculations are made at the end of the month.For practical purposes, generalisations were made about the available water capacity of the soils at each site.
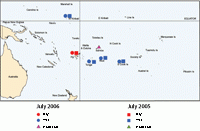
At the end of July 2006, Tarawa, Fua'amotu, Hanan Airport, and Rarotonga were at field capacity (full). Nadi soils were dry, typical for the time of the year. Apia soils were moderate.
El Niño/Southern Oscillation (ENSO)


The tropical Pacific remains in a neutral state, though there has been continued warming in the upper layers of the Equatorial Pacific Ocean the past two months. Equatorial Pacific sea surface temperature (SST) anomalies are now positive across the whole basin.
The NINO3 SST anomaly for July was about +0.5 °C (+0.4°C for May-July) and NINO4 was about +0.6 °C (+0.5°C for May-July). Subsurface temperature anomalies have strengthened a little further in the east, with a +2 °C anomaly now east of 120°W in the top 50-100 m.
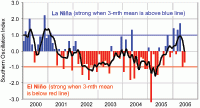
The Southern Oscillation Index (SOI) fell slightly to -0.9 in July, from -0.7 in June, with the May-July mean at -0.9. There have been significant westerly wind anomalies along the equator in July, west of the Date Line. The NASA ENSO precipitation index was +0.65 for July, up from -1.1 in June, suggesting a fairly rapid change in the organisation of convection in the tropical Pacific.
Most models keep SST anomalies at or slightly above their present levels through the rest of the year, with four predicting at least a weak El Niño state by late 2006. The NCEP synopsis is for neutral conditions until October, and an uncertain outlook over summer 2006/07.
The IRI indicate neutral ENSO conditions are favoured for the remainder of 2006, with a 65% likelihood through September, and 60% thereafter. An El Niño is rated as a 35% probability by year-end, with La Niña at 5% probability.
Madden-Julian Oscillation (MJO) and Subtropical highs
The MJO has shown some activity lately, with a convective centre moving across the Date Line over the last couple of weeks. The amplitude is fairly weak at present.
During July, the latitude of the subtropical high pressure belt was at about 30°S across the South Pacific. These were stronger than normal west of the Date Line, and weaker than normal east of the Date Line.
