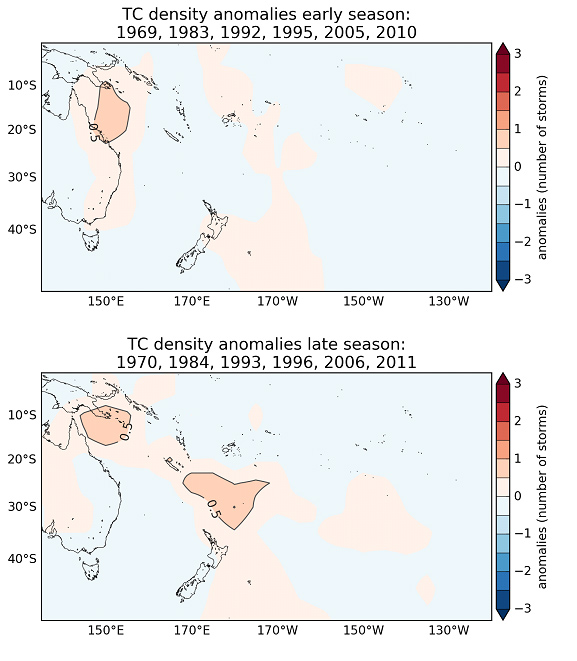
Figure 4: Early season (November to January) and late season (February to April) anomaly plots for selected TC analog seasons (data courtesy of South Pacific Enhanced Archive for Tropical Cyclone research (SPEArTC)). The year label notes the first month in the analog selection (i.e. for the early season 1969 = November 1969, December 1969, January 1970; and for the late season 1970= February – April 1970).