Water resources in summer 2001–02
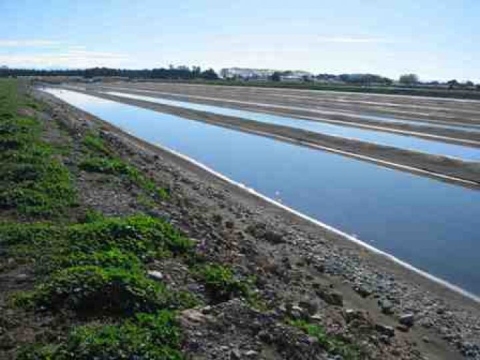
River flow
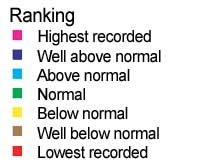
River flows for much of New Zealand were above normal, except for the west and south of the South Island. The high flows were caused by the unusually wet, cool summer.

Water clarity
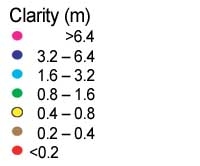
Water clarity was well below normal in many rivers, often as a result of the extra sediment carried by unusually high river flows. Last summer one-third of sites met the recommended level for safe swimming (>1.6 m), whereas typically two-thirds of sites meet this level. (Clarity here is the horizontal distance you can see underwater.)


Slime index
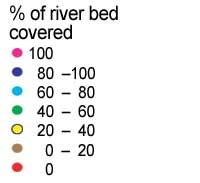
The slime index records the cover of the river bed by "nuisance" slimes (algae growing as thick mats or filamentous growths) that reduce the recreational and aesthetic value of the river if too prolific (i.e., cover exceeds 30–60%). Slimes are encouraged by warm temperatures, sunlight, nutrients (especially nitrogen and phosphorus), and lack of floods. Maximum values were generally low this summer, probably reflecting unstable river flows.

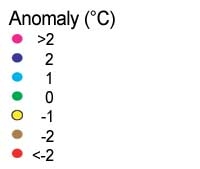
Water temperatures
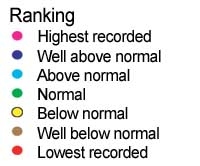
Water temperatures were normal or below normal for most sites as a result of the cooler weather and high flows. (The anomaly is the difference between the temperature last summer and the median temperature in all summers since 1989.)


These data are provided by NIWA field teams, regional and district councils, and hydro-power companies. They are preliminary (subject to amendment after quality assurance procedures), and we hope to expand the coverage with contributed measurements using standard methods at long-term sites.
For information on hydroelectricity storages, see COMIT Free To Air (www.electricityinfo.co.nz/comitFta/ftaPage.main).
Groundwater levels

Groundwater levels followed the typical pattern of summer declines. Above-normal rainfall from Otago to Northland generally meant good rainfall recharge to groundwater over summer.
Groundwater levels were generally average in North Auckland, Auckland, Waikato, Bay of Plenty, East Coast, Hawke’s Bay, Wairarapa, Tasman, and Marlborough when compared with the historical record. Levels in Tasman and Marlborough have improved considerably after the 2000–01 summer, when they approached, or dropped below, historic lows.
Taranaki, Manawatu, and Wellington groundwater levels were higher than the average historical record in the period, because of the high rainfall.
Levels in Otago, Canterbury, West Coast, and Southland were generally below average. In Otago and Canterbury some levels increased over summer and others followed the usual trend of declines. Rainfall recharge recorders have measured recharge in Canterbury since 1994, and summer recharge was recorded this year for the first time. For example, rainfall of 300 mm in inland Canterbury has led to 134 mm of rainfall recharge. Rainfall has probably also led to a decrease in the need for irrigation. This means less pumping from groundwater than in a typical summer.
Groundwater information is supplied by the Institute of Geological and Nuclear Sciences Ltd.