River water temperatures and visual clarity of rivers.
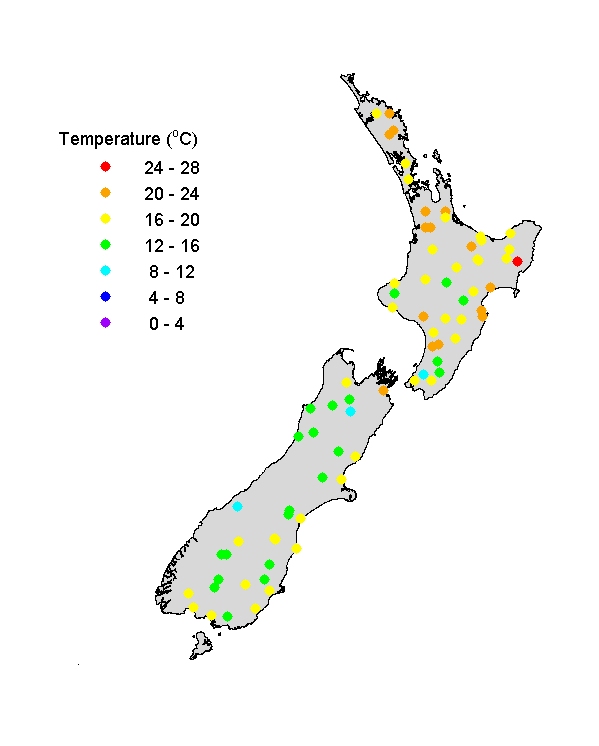
River water temperatures (JFM)
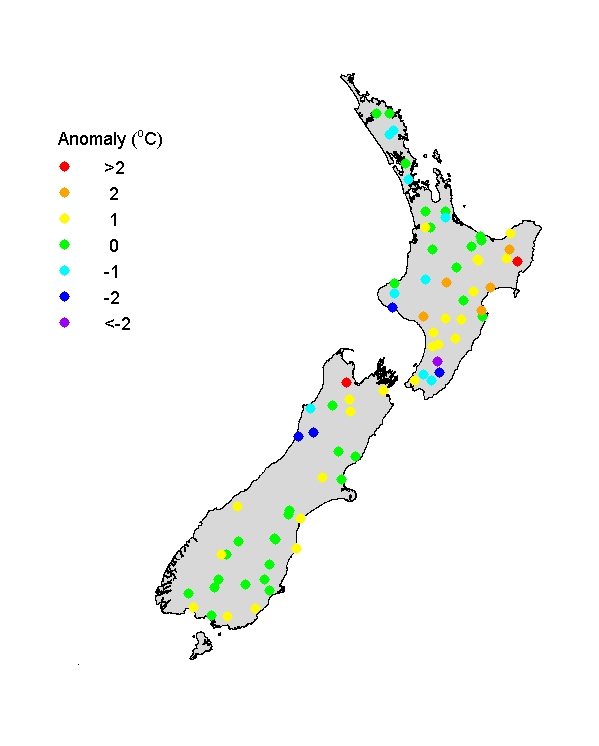
Summer river water temperatures were mostly around 20oC in North Island and a little lower in the South Island. As usual there is a weak trend of decreasing temperature moving south (increasingly latitude), and a more definite trend of decreasing temperature with increasing altitude. The temperature anomaly map shows that river temperatures were normal to somewhat higher than normal for summer over most of both islands of New Zealand. The Waipaoa River (eastern North Island) and Motueka River (northern South Island) were both unusually warm, while the Ruamahanga River (southern North Island) and Grey River (western South Island) were unusually cool.
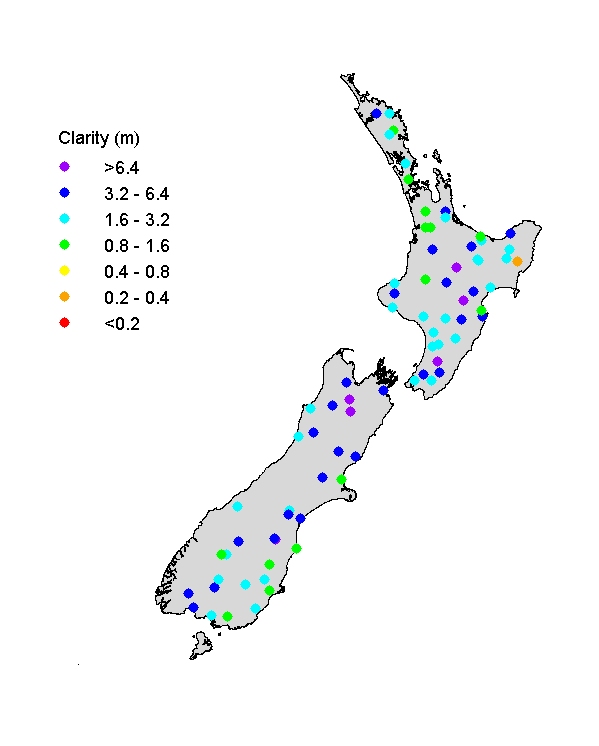
Visual clarity of rivers (JFM)
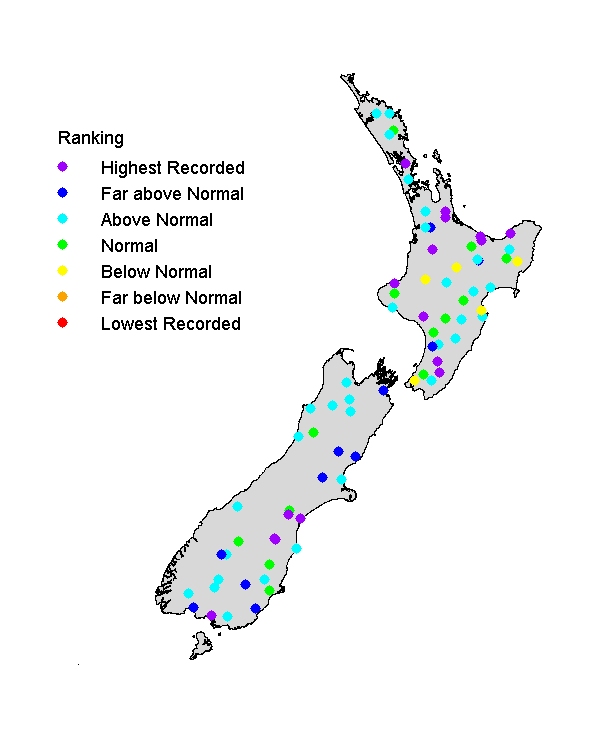
Visual clarity of rivers in New Zealand ranges widely reflecting the diversity of soil and rock types modified by vegetation cover and land use. Furthermore, flows in any one river can vary widely, depending mainly on state-of-flow. Over the past summer, most New Zealand rivers were clearer than typical (many exceeding 6 m visibility) reflecting low to very low flows. Fourteen of the 77 NRWQN river monitoring sites, distributed widely around the country, recorded record high visual clarities usually under very low flow conditions.