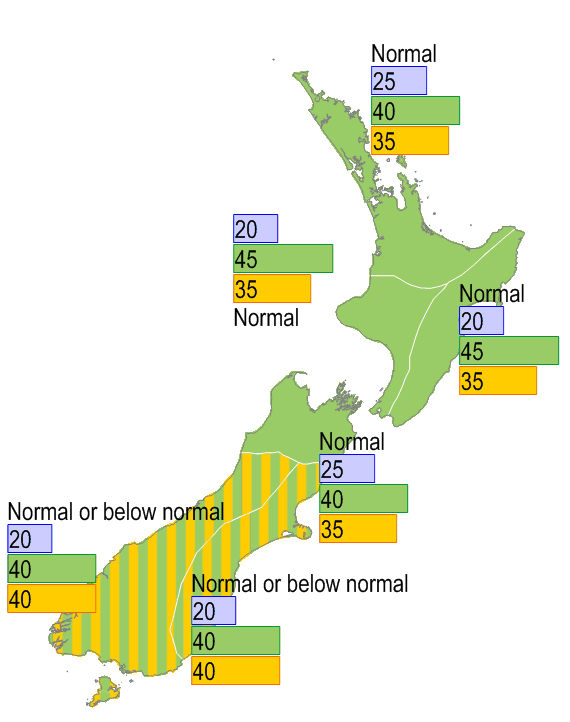
What we predicted for July 2011 to September 2011
River flows are likely to be normal in the North Island and north of the South Island, and normal or below normal in the rest of the South Island.
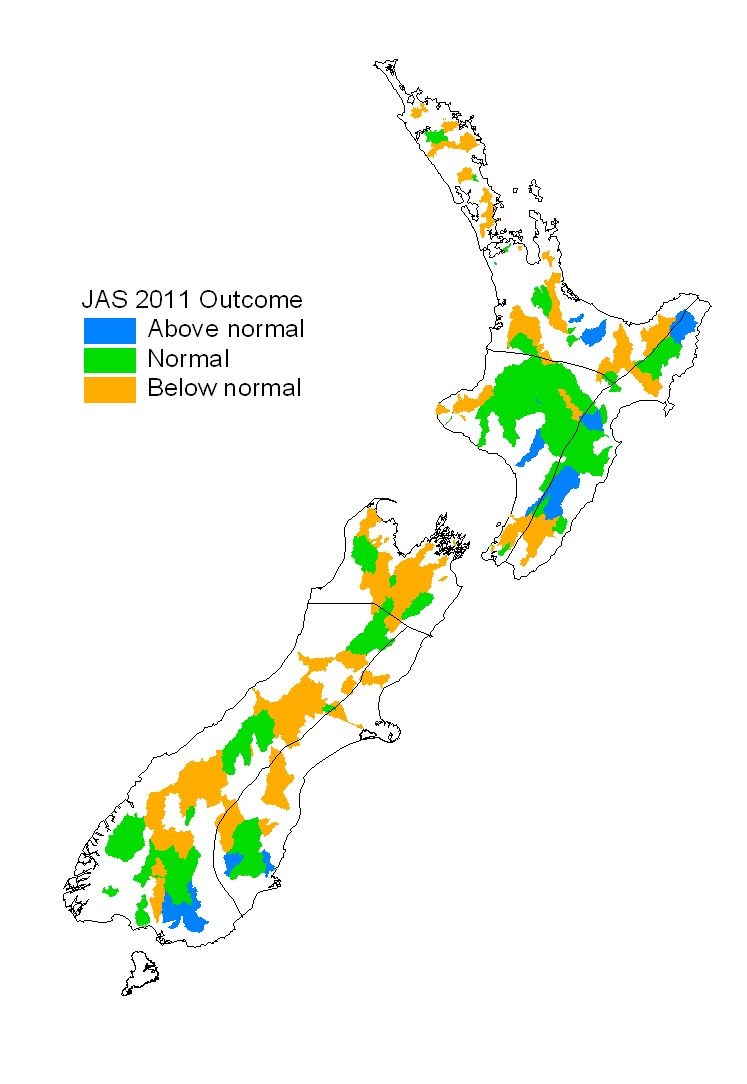
What actually happened during July 2011 to September 2011
River flows were normal to below normal for most of the country, with some above normal river flows in the eastern North Island, eastern Southland and coastal Otago.
The map on the top right shows our prediction of seasonal river flows made in July, and the map below is the outcome.
Full monthly and seasonal climate summaries are available from NIWA's National Climate Centre
Note on mapped quantities
Mapped quantities for last month and the last three months are based on the position of those flows in a distribution of historical flows from each flow recorder for that month or that season (where a season is any contiguous three month period). At present the data used to estimate the distribution are flow data from the beginning of each flow record up to the year 2000. If a catchment is mapped as 'normal' this means that the flows for the period were in the middle tercile (third) of the historic distribution. Catchments mapped as 'far below' or 'far above' normal mean that their flows for the period correspond to the bottom or top 10% of the historic distribution. Catchments mapped as 'below' or 'above' normal had their flows respectively in the bottom or top tercile but not in the most extreme 10% of historic flows.