Rainfall outlook for June to August 2002
Above average rainfall in equatorial latitudes from Nauru to Kiribati
Average to below average rainfall in Papua New Guinea, Fiji and the Marquesas and Austral Islands
Below average rainfall for New Caledonia and Samoa
Mainly average rainfall in other areas
In the Western Pacific, the South Pacific Convergence Zone (SPCZ) was further south of its normal position lying just north of Vanuatu and Fiji during May. It lay further northeast than average east of the date line, lying just north of the Cook Islands and over parts of French Polynesia. Rainfall is projected to trend towards being above average in Western and Eastern Kiribati for the June – August period. Rainfall is likely to be below average to average in Papua New Guinea, Fiji, and the Marquesas and Austral Islands. Below average rainfall is forecast for New Caledonia and Samoa.Near average rainfall is projected for the Solomon Islands, Tuvalu, Vanuatu, Tokelaus, Tonga, Southern and Northern Cook Islands, Society and Tuamoto Islands and Pitcairn.
Rainfall outlook map for June to August 2002
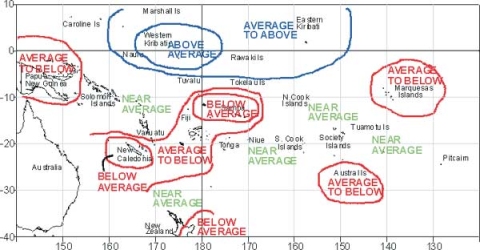
Probabilities of rainfall departures from average
Broad-scale rainfall patterns and anomalies in the southern tropical Pacific area are estimated from the state of large-scale regional climate factors, such as La Niña or El Niño, their effect on the South Pacific and Tropical Convergence Zones, surface and sub-surface sea temperatures, and computer models of the global climate.
Rainfall estimates for the next three months for Pacific Islands are given in the adjacent table. The tercile probabilities (e.g. 20:30:50) are derived from the interpretation of several global climate models. They correspond to the odds of the observed rainfall being in the lowest (driest) one third of the rainfall distribution, the middle one third, or the highest (wettest) one third of the distribution. On the long-term average, rainfall is equally likely (33% chance) in any tercile.
The probabilities shown express the expected shift in the distribution from the long-term average, based on predictions of oceanic and atmospheric conditions. The amount of inter-model forecast consistency is indicated by the levels of confidence expressed in the table.
| Island Group | Rainfall Outlook | Confidence in the Outlook | |
|---|---|---|---|
| Western Kiribati | 20:30:50 | Above | High |
| Eastern Kiribati | 20:45:35 | Average to above average | High |
| Solomon Islands | 30:45:25 | Near average | Moderate |
| Vanuatu | 20:45:35 | Near average | Low |
| Tuvalu | 30:40:30 | Near average | Moderate |
| Tokelau | 30:40:30 | Near average | Moderate |
| Tonga | 30:50:20 | Near average | Moderate |
| Niue | 30:50:20 | Near average | Low-Moderate |
| Northern Cook Islands | 35:50:15 | Near average | Low |
| Southern Cook Islands | 25:50:25 | Near average | Low |
| Society Islands | 35:45:20 | Near average | Low |
| Pitcairn Island | 30:50:20 | Near average | Low |
| Papua New Guinea | 35:45:20 | Average to below average | Low |
| Fiji | 40:40:20 | Average to below average | Low |
| Austral Islands | 40:40:20 | Average to below average | Low |
| Marquesas | 40:40:20 | Average to below average | Low |
| New Caledonia | 45:30:25 | Below average | Moderate |
| Wallis & Futuna | 45:35:20 | Below average | Moderate |
| Samoa | 45:35:20 | Below average | Low |
Rainfall outcomes as estimated from models and historical records. The third column indicates the probability of bottom (below), middle (average) or top (above) tercile rainfall, where a percentage is given. The rainfall outlook (second column) is subjectively estimated from the probabilities of bottom, middle and top terciles.