Outlook summary
- El Niño continued during December and has around a 100% chance of persisting through March. Although it will continue to have an important influence on Aotearoa New Zealand’s climate, unusual ocean heat in the western Pacific and on a global scale has contributed to circulation patterns that are not historically associated with El Niño.
- Air pressure is forecast to be above normal near and north of the country and below normal to the south. This is expected to cause more northwesterly quarter winds than normal.
- The type of El Niño being experienced will likely result in more variable rainfall patterns than experienced during strong El Niños in the past. This may be expressed by a period of heavy rain in mid-to-late January, particularly for the North Island and northern South Island.
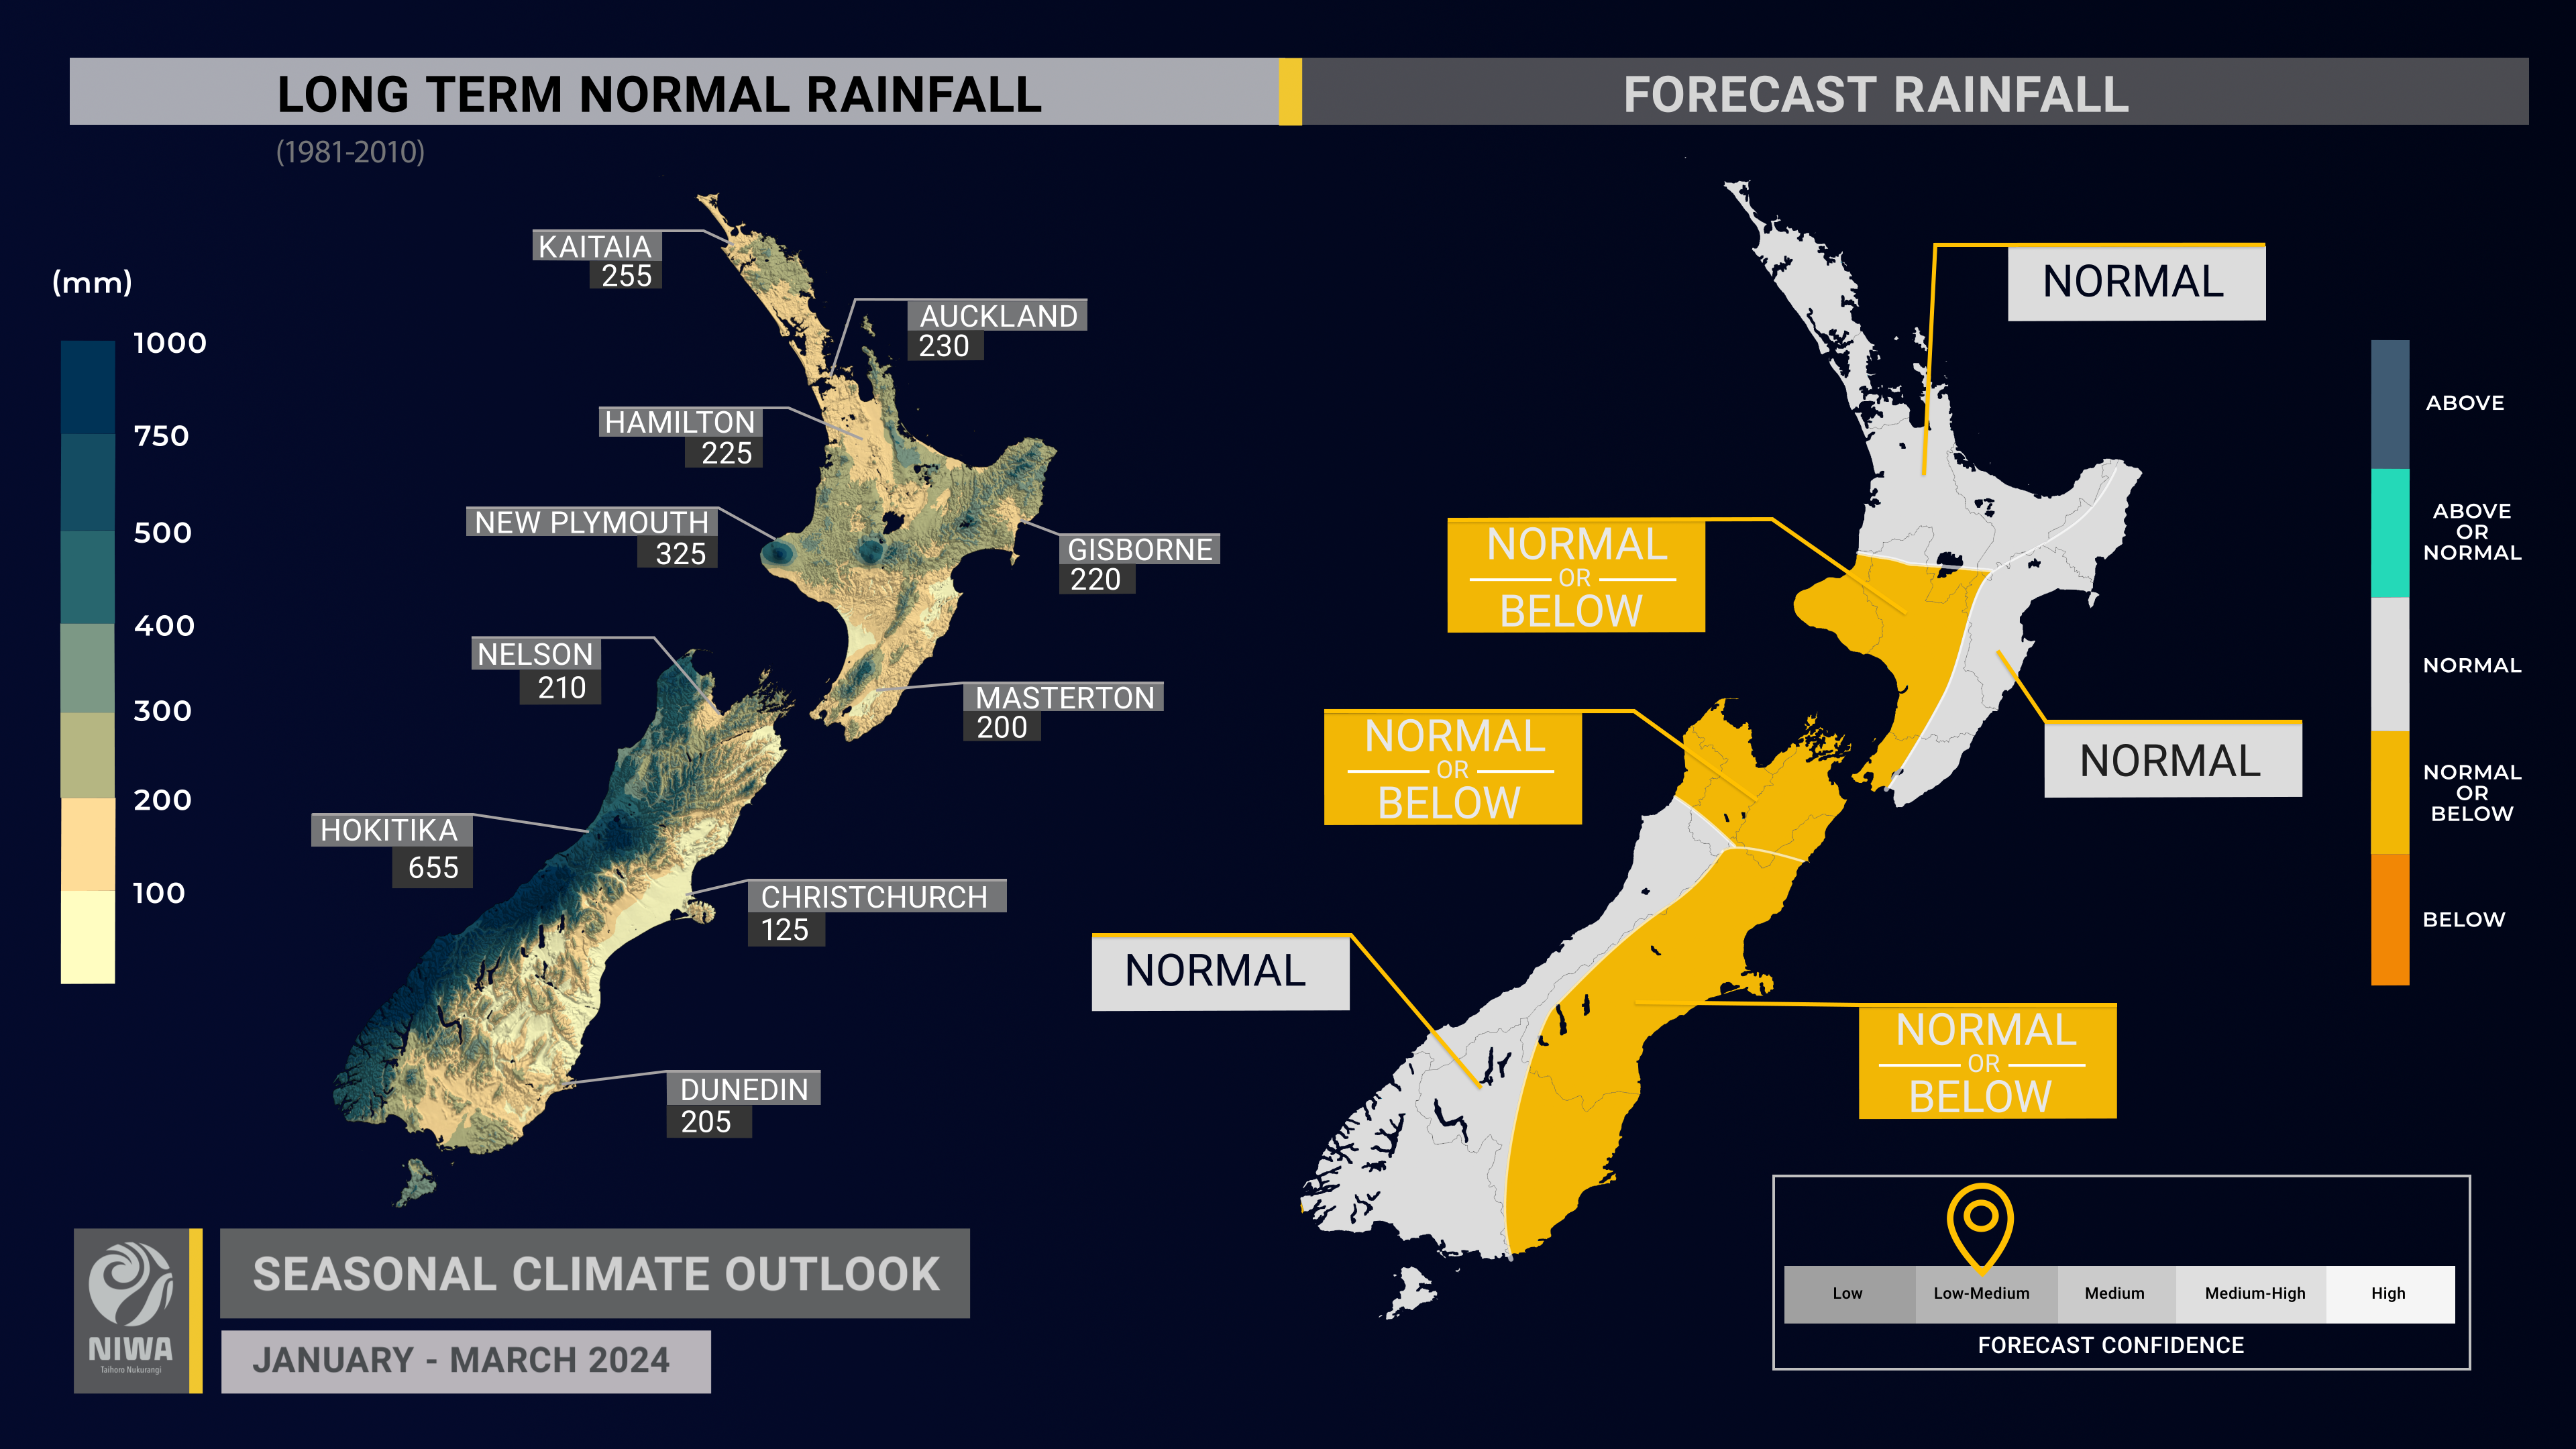
- Rainfall is most likely to be near normal in the north and east of the North Island and west of the South Island. Near normal or below normal rainfall are about equally likely elsewhere.
- According to the New Zealand Drought Index, several regions were experiencing unusual dryness as of early January. This may contribute to water restrictions. Climate-sensitive sectors are encouraged to make use of the New Zealand drought dashboard.
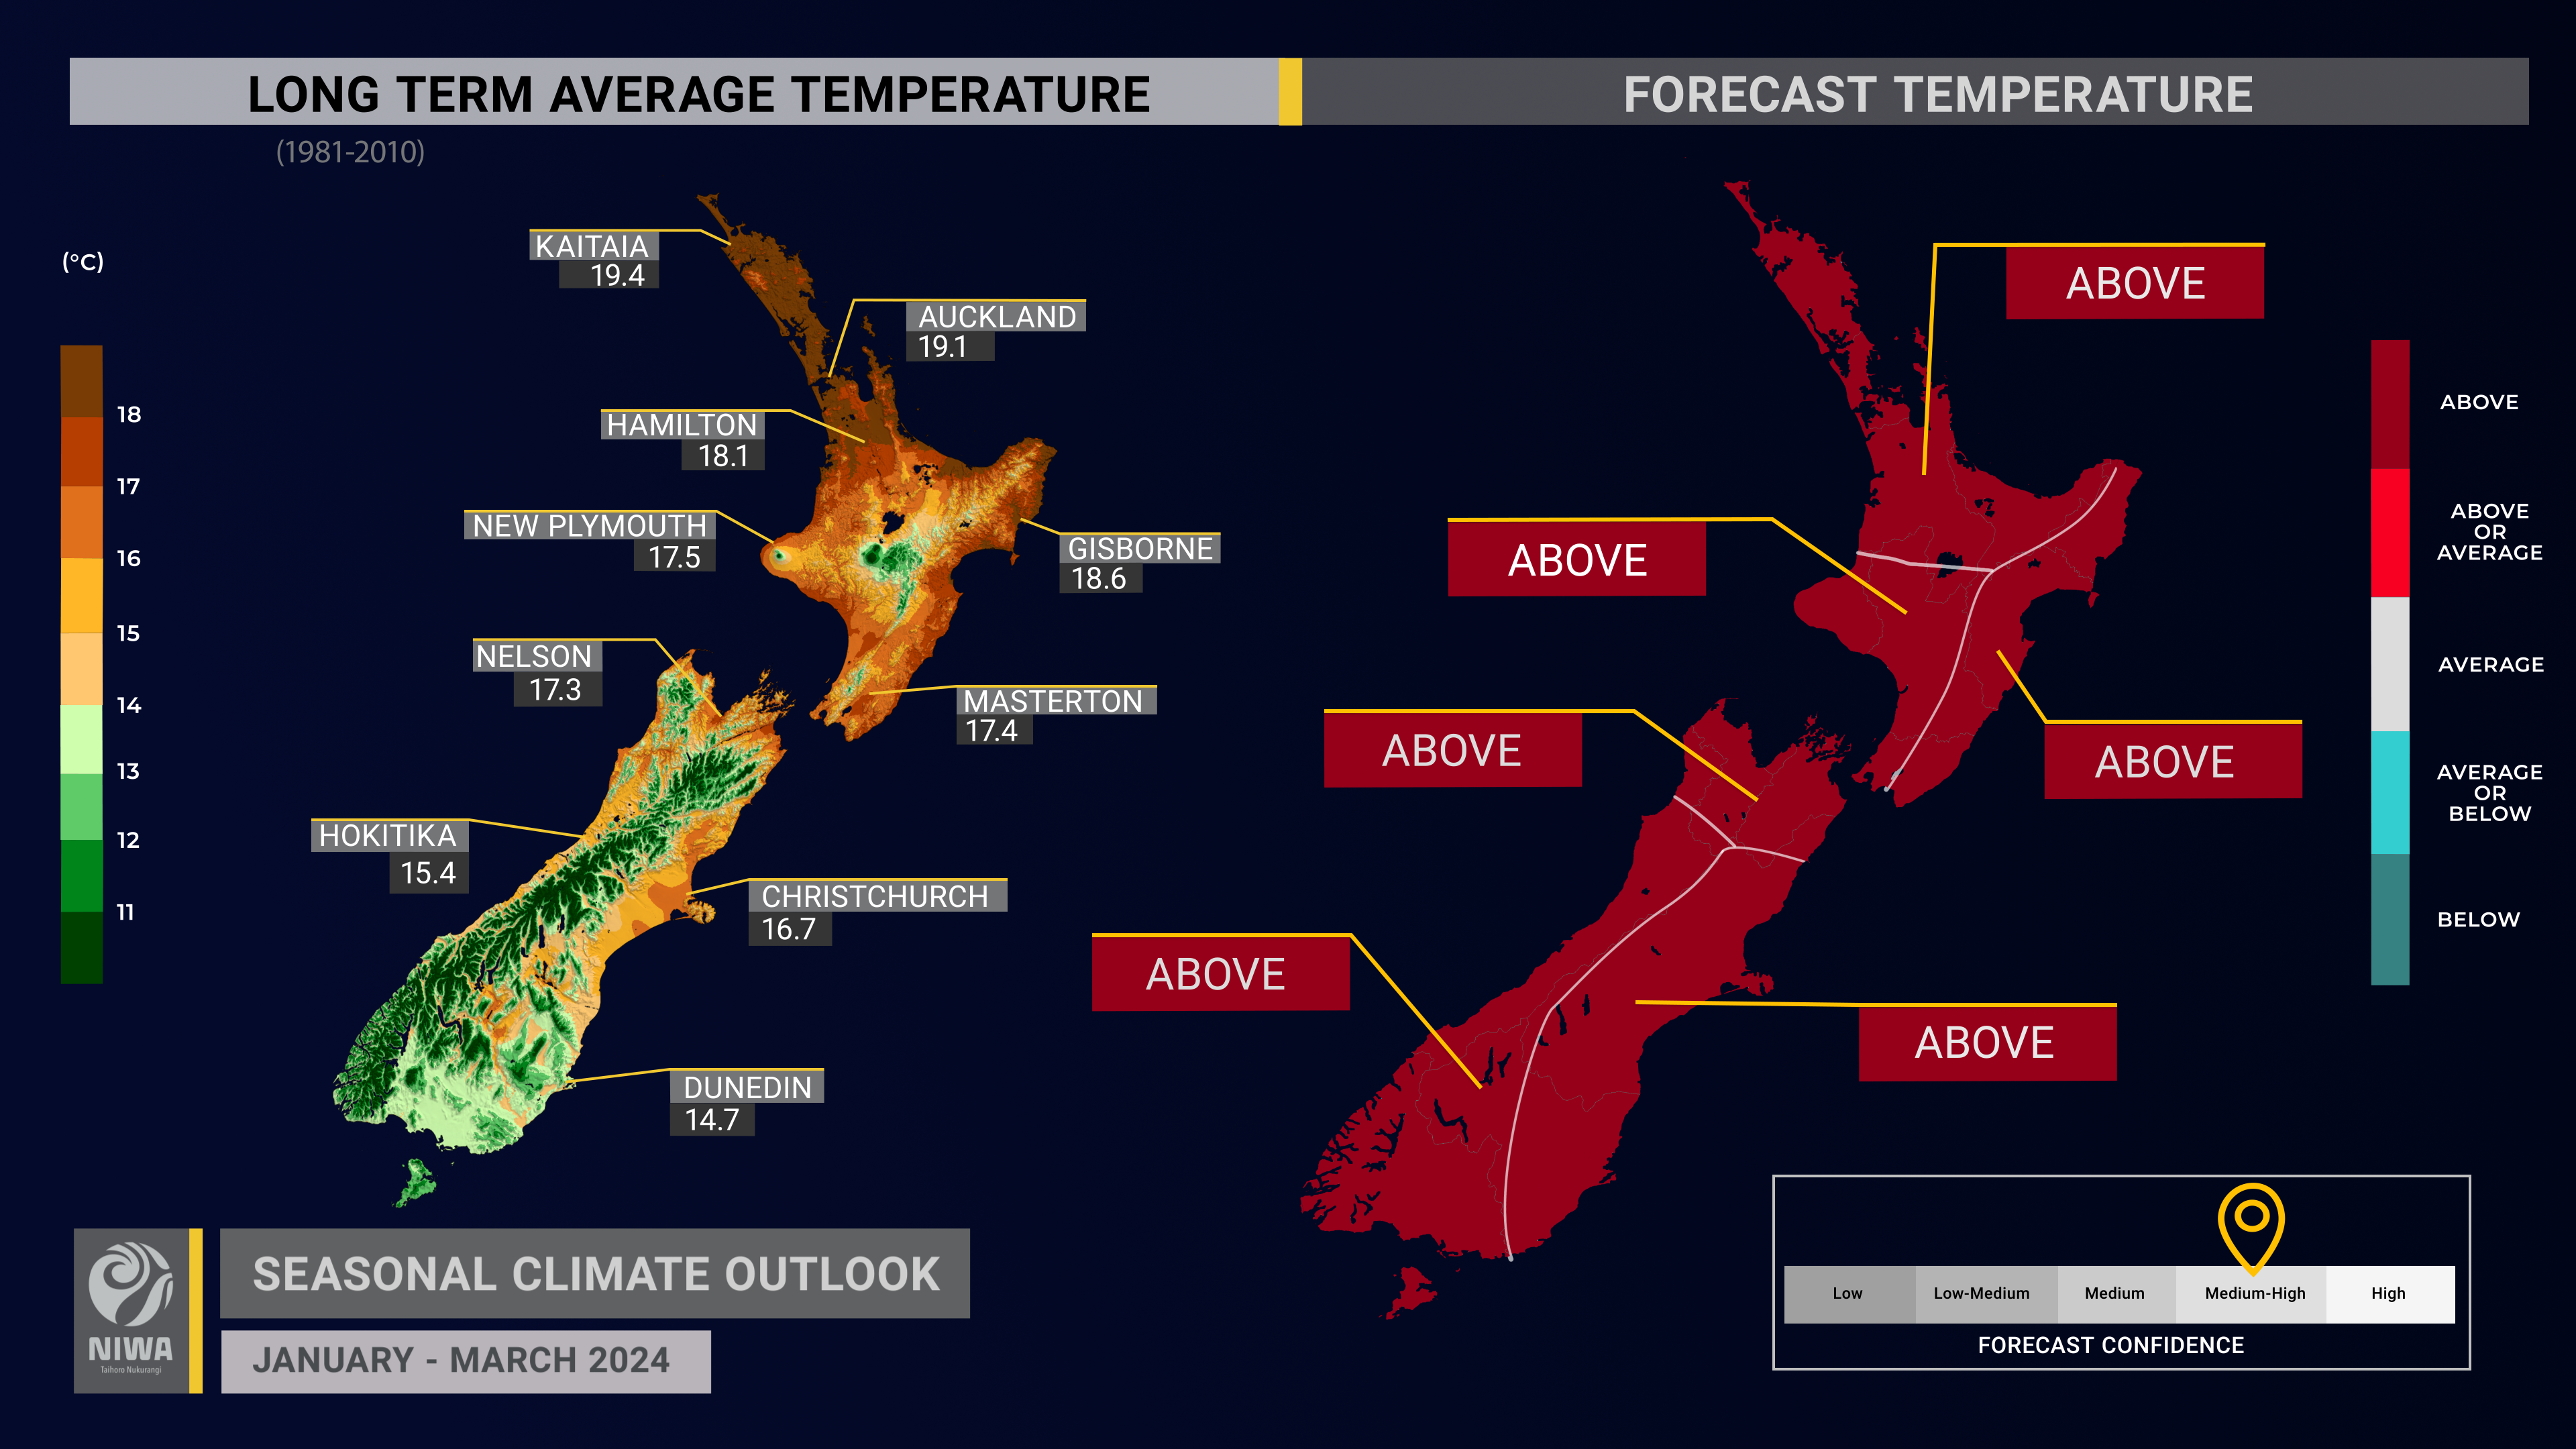
- Temperatures are likely to be above average in the west of the South Island and very likely to be above average elsewhere, owing to more frequent northwesterly quarter winds.
- Wind strength is forecast to be above normal in the South Island and lower North Island.
Coastal sea surface temperatures (SSTs) ranged from -0.06˚C below average to 0.43˚C above average during December. Localised marine heatwaves were occurring in coastal Canterbury, Hawke’s Bay, Gisborne, Bay of Plenty, and Auckland as of early January.
Marine heatwaves north of New Zealand may enhance the heat and humidity associated with air masses that track toward the country, such as in mid-to-late January. This may cause a marine heatwave to develop or intensify near the North Island.
Soil moisture and river flows are about equally likely to be near normal or below normal in all regions.
Regional predictions for January – March 2024
The tables below show the probabilities (or percent chances) for each of three categories: above average, near average, and below average. In the absence of any forecast guidance there would be an equal likelihood (33% chance) of the outcome for any of the three categories. Forecast information from local and global guidance models is used to indicate the deviation from equal chance that is expected for the coming three-month period. All outlooks are for the three months as a whole. There will inevitably be relatively wet and dry days, and hot and cold days, within a season. The exact range in temperature and rainfall within each of the three categories varies with location and season. However, as a guide, the “near average” or middle category for the temperature predictions includes deviations up to ±0.5°C for the long-term mean, whereas for rainfall the “near normal” category lies between 80 per cent and 120 per cent of the long-term (1991-2020) mean.
Northland, Auckland, Waikato, Bay of Plenty
- Temperatures are very likely to be above average (60% chance). Spells of hot and very humid conditions are expected in mid-to-late January.
- Rainfall totals are most likely to be near normal (45% chance). Spells of heavy rain may occur in the second half of January. However, the season may also be defined by longer dry spells, particularly in February-March.
- Soil moisture levels and river flows are equally likely to be near normal (40% chance) or below normal (40% chance).
| Temperature | Rainfall | Soil moisture | River flows | |
| Above average | 60 | 30 | 20 | 20 |
| Near average | 30 | 45 | 40 | 40 |
| Below average | 10 | 25 | 40 | 40 |
Central North Island, Taranaki, Whanganui, Manawatu, Wellington
Probabilities are assigned in three categories: above average, near average, and below average.
- Temperatures are very likely to be above average (60% chance). Spells of hot and very humid conditions are expected in mid-to-late January.
- Rainfall totals are about equally likely to be near normal (40% chance) or below normal (35% chance).
- According to the New Zealand Drought Index, moderate to very dry conditions are occurring across parts of the region, with longer dry spells expected to continue over the next season.
- Spells of rain, possibly heavy, may occur in the second half of January.
- Seasonal wind speeds are expected to be stronger than normal.
- Soil moisture levels and river flows are about equally likely to be below normal (45% chance) or near normal (40% chance).
| Temperature | Rainfall | Soil moisture | River flows | |
| Above average | 60 | 25 | 15 | 15 |
| Near average | 30 | 40 | 40 | 40 |
| Below average | 10 | 35 | 45 | 45 |
Gisborne, Hawke’s Bay, Wairarapa
Probabilities are assigned in three categories: above average, near average, and below average.
- Temperatures are very likely to be above average (60% chance). Spells of hot and very humid conditions are expected in mid-January.
- Rainfall totals are most likely to be near normal (45% chance). Spells of heavy rain may occur in the second half of January. However, the season may also be defined by longer dry spells, particularly in February-March.
- According to the New Zealand Drought Index, moderate to very dry conditions are occurring across southern parts of the region.
- Seasonal wind speeds are expected to be stronger than normal.
- Soil moisture levels and river flows are about equally likely to be near normal (45% chance) or below normal (40% chance).
| Temperature | Rainfall | Soil moisture | River flows | |
| Above average | 60 | 30 | 15 | 15 |
| Near average | 30 | 45 | 45 | 45 |
| Below average | 10 | 25 | 40 | 40 |
Tasman, Nelson, Marlborough, Buller
Probabilities are assigned in three categories: above average, near average, and below average.
- Temperatures are very likely to be above average (60% chance). Hot and very humid conditions are expected in mid-January, lasting about a week.
- Rainfall totals are about equally likely to be near normal (40% chance) or below normal (35% chance).
- According to the New Zealand Drought Index, moderate to very dry conditions are occurring across central and eastern parts of the region, with longer dry spells expected to continue over the next season.
- Spells of rain, possibly heavy, may occur in the second half of January.
- Seasonal wind speeds are expected to be stronger than normal.
- Soil moisture levels and river flows are about equally likely to be below normal (45% chance) or near normal (40% chance).
| Temperature | Rainfall | Soil moisture | River flows | |
| Above average | 60 | 25 | 15 | 15 |
| Near average | 30 | 40 | 40 | 40 |
| Below average | 10 | 35 | 45 | 45 |
West Coast, Southern Alps and foothills, inland Otago, Southland
Probabilities are assigned in three categories: above average, near average, and below average.
- Temperatures are most likely to be above average (55% chance each).
- Rainfall totals are about most likely to be near normal (45% chance). Periods of drier than normal conditions in January may give way to more frequent fronts and lows later in the season, with occasional heavy rainfall and a risk for flooding.
- According to the New Zealand Drought Index, moderate to extremely dry conditions are occurring across parts of the region, with longer dry spells expected to continue through at least the next month.
- Seasonal wind speeds are expected to be stronger than normal.
- Soil moisture levels and river flows are about equally likely to be below normal (45% chance) or near normal (40% chance).
| Temperature | Rainfall | Soil moisture | River flows | |
| Above average | 55 | 30 | 15 | 15 |
| Near average | 35 | 45 | 45 | 45 |
| Below average | 10 | 25 | 40 | 40 |
Coastal Canterbury and the nearby plains, east Otago
Probabilities are assigned in three categories: above average, near average, and below average.
- Temperatures are very likely to be above average (60% chance). Hot, humid conditions are expected around 10 January, possibly giving way to cooler conditions in the second half of the month.
- Rainfall totals are about equally likely to be near normal (40% chance) or below normal (35% chance).
- According to the New Zealand Drought Index, moderate to extremely dry conditions are occurring across parts of the region, with longer dry spells expected to continue.
- Periodic wetter than normal conditions may occur when rain bands “spill over” the main divide or during strong southerly changes.
- Seasonal wind speeds are expected to be stronger than normal.
- Soil moisture levels and river flows are about equally likely to be near normal (40% chance) or below normal (45% chance).
The full probability breakdown is:
| Temperature | Rainfall | Soil moisture | River flows | |
| Above average | 60 | 25 | 15 | 15 |
| Near average | 30 | 40 | 40 | 40 |
| Below average | 10 | 35 | 45 | 45 |
Graphical representation of the regional probabilities

Background
TheNINO3.4 Index anomaly (which covers the west-central equatorial Pacific) over the last month (through 31 December 2023) was +2.01˚C, within the range of a very strong El Niño (classified when the NINO3.4 Index is greater than +2.0˚C). In terms of 30-day anomalies ending 31 December, the NINO3.4 Index is exceeded by 2015, 1982, and 1997, with records dating back to 1981.
The Southern Oscillation Index (SOI) was in the neutral range during December (-0.4) and on the El Niño side of neutral from October-December (-0.6).
This suggests that El Niño’s reflection in the atmosphere is atypical, particularly considering the oceanic intensity. It also helps to explain why air pressure and circulation patterns have been out-of-sync with what’s expected during a strong El Niño in a New Zealand context.
Of the models monitored by NIWA, there’s around a 100% chance of El Niño continuing through March and around an 85% chance for the continuation of El Niño conditions through autumn. ENSO neutral conditions are favoured during winter (around a 55% chance).
Trade wind strengthwas below or well below normal in the central and west-central equatorial Pacific during December, allowing the oceanic El Niño to reach near its peak intensity. Trade winds are forecast to strengthen during January, likely seeing the El Niño event weaken slightly from an oceanic perspective by February.
In the subsurface equatorial Pacific, anomalies of +3 to +6˚C were occurring in the upper 100 m in the central and east as of late December. Anomalies of +2˚C persisted in the vicinity of the International Dateline, as did the warmest SSTs. Because most of the equatorial Pacific Ocean is unusually warm, the El Niño is best described as a “full basin” event. The climatic impacts from a “full basin” event have been and will continue to be different from a classical, east-based event.
During December,convective forcing focused in the west-central tropical Pacific. Notably, activity was reduced over the eastern tropical Pacific, contrary to what is expected of a strong oceanic El Niño. Forcing was greatly reduced over the eastern tropical Indian Ocean and western Australia, in association with the strongly positive Indian Ocean Dipole.
More specifically, convective forcing has been commonly located west of what is typical during strong El Niño events, likely owing to the basin-wide signal of above average sea temperatures in the Pacific and anomalous ocean heat on a global scale. This has contributed to weather patterns not typically associated with El Niño events in New Zealand.
As of early January, the Madden-Julian Oscillation (MJO) was active in the Indian Ocean (phases 2-3), with the outlook favouring a propagation into the Maritime Continent and West Pacific during the second half of the month (phases 4-6).
This progression typically favours high pressure initially and then low pressure near and north of New Zealand once the MJO reaches the Maritime Continent and West Pacific. This may contribute to a risk for heavy rainfall and flooding from the third week of the month, particularly in the North Island and northern South Island. Significant heat and humidity is also expected to build across the country in mid-to-late January, lasting the longest in the North Island.
Following the MJO activity in the western Pacific during late January, guidance supports movement into the eastern Pacific, the Americas, and Africa during February. Convective forcing near the International Dateline, which has been a major source of climatic variability over the last year, is expected to wane in February-March. This may mean that New Zealand becomes less exposed to northerly low pressure systems later in the three month period and that westerly winds become more common. Regions that have yet to experience persistent drier-than-normal conditions should remain prepared for that possibility once this change occurs.
The impacts from the 2023-24 El Niño will continue to be distinctly different from 2015-16, 1997-98, and 1982-83 for New Zealand. Climate-sensitive sectors are encouraged to make use of the New Zealand drought dashboard, which provides 35-day outlooks of rainfall and drought, updated once daily: https://niwa.co.nz/climate/seasonal-climate-outlook
A positive Indian Ocean Dipole (IOD) continued as of late December. The IOD’s influence on New Zealand appears to have been minimal during December, with the Outgoing Longwave Radiation signal focused over Indonesia and western Australia. Widespread marine heatwave activity in the western and central Tasman Sea and Coral Sea have likely played a more important role for New Zealand, superseding the IOD influence. The strength of the IOD is likely to ease during January, particularly as MJO activity moves across the Maritime Continent and monsoonal rainfall intensifies.
The Southern Annular Mode (SAM) was positive during December and is expected to remain positive through the first half of January, with high pressure in the New Zealand region and low pressure around Antarctica.
New Zealand’s coastal water temperatures were above average near the northern and eastern coasts of both islands. Marine heatwave conditions were widespread in the western and central Tasman Sea and Coral Sea. These marine heatwaves may contribute to excessive heat and humidity in New Zealand during mid-to-late January, particularly in the North Island. This may cause marine heatwaves to develop or intensify. For more info, see the NIWA Sea Surface Temperature Update.
| North NI | +0.37˚C |
| West NI | +0.05˚C |
| East NI | +0.43˚C |
| North SI | -0.02˚C |
| West SI | -0.06˚C |
| East SI | +0.42˚C |
Forecast confidence

Temperature
Forecast confidence for temperatures is medium-high. The combination of more northwesterly winds and building oceanic warmth, including regional marine heatwaves, favours above average seasonal temperatures. Periods of high humidity, such as was experienced during December, are also likely.

Rainfall
The effect of a non-traditional El Niño pattern and above average warmth in the western Pacific Ocean is contributing to a more challenging seasonal rainfall prediction and lower confidence overall. The rainfall patterns experienced during December may be a guide toward what the next three months hold.