What is a mass spectrometer?
From crime scenes to the bottom of the ocean, scientists are often analysing samples to find out what chemicals they contain, and this often involves a mass spectrometer. But what is a mass spectrometer, and how do they work?
Light can be split by a prism into a spectrum of different colours which take different paths. Mass spectrometers use different physics to produce a similar end result, but with molecules with different masses taking different paths, producing a 'mass' spectrum.
Mass spectrometers use an interesting mix of physics to charge, accelerate and then deflect the path of atoms and molecules. Once an electron is removed from an atom or molecule, they respond strongly to electric and magnetic fields, and are referred to as ions.
Making the ions fly through a strong magnetic field curves their path, but because the force is proportional to the charge, heavier molecules are deflected less, fanning the paths of the ions out similar to the spectrum produced by an prism. Charge sensitive detectors sit at the end of the flight path, and every time an ion is collected it produces a current, which is recorded and used to calculate the ratio of different masses.
If you use a sample with a huge mix of molecules with different masses, it can end up to be almost impossible to work out what a sample is made of. However, with careful preparation samples can reveal an enormous amount.
How NIWA uses mass spectrometers
NIWA uses the ratios of different types, or isotopes, of oxygen to perform a lot of its research. Not all oxygen atoms are the same. The centre, or nucleus of an atom is what makes up the majority of its mass, and consists of protons and neutrons. The number of protons (8) is always the same, but the number of neutrons can vary, and these different varieties are known as isotopes. Although over 99% have 8 neutrons (16O), oxygen also comes with 10 neutrons (18O around 0.2%), and 9 (17 O less than 0.04%). This last one is so rare we'll leave it out of the following example to make it simpler.
Because 18O is heavier than 16O, water molecules (H2O) which contain the 'heavier' oxygen are slightly less likely to evaporate than water comprised of the 'light' oxygen. This means that rain and snow has, on average, a slightly different ratio of 18O to 16O (δ18O) than the ocean. We can detect this small difference with a mass spectrometer. This effect is stronger for the warmer parts of the ocean, which leads to different parts of the ocean having different δ18O ratios, which we can see across the ocean today.
Using δ18O to see into the past
During ice ages, water that evaporated from the ocean preferentially contained 16O and went on to be trapped as snow and ice at the poles, trapping the 16O, which means the overall the ration of 18O in the ocean went up. Because sea creatures use oxygen in their hard parts (shells), it can match the water they live in, and after they die their remains build up on the sea floor, it's possible to see a pattern of different ice ages going back hundreds of thousands of years in sediment cores from the seabed. These changes in δ18O are very small, but modern mass spectrometers are enormously sensitive, they've come a long way since they were invented in 1912.
We can use this information to work out what ocean conditions were like in the past when ancient snow was formed, or what ocean temperatures were like when sea creatures were alive. Both these techniques involve drilling cores deep into glaciers or the sea bed, allowing us to get data ranging back hundreds of thousands of years. There are limits to what can be determined from these kinds of temperature measurements, or proxies, as they are known, but when multiple different proxies agree with each other it greatly increases our confidence in the results.
For example, in younger ice cores you can see lines for each winter's heavier snowfall and count them like tree rings. It's also possible to calculate how much snow fell each year. You can take the same slice of snow and analyse its δ18O ratio, and see that it is opposite the signal in the ocean, i.e. as the 16O is removed from the ocean it ends up in icecaps. Rare events like volcanic eruptions, which can also be dated in a number of other ways, leave ash signals in ice cores and ocean sediments, which means we can increase our confidence in the conclusions we draw from these data.
Carbon 13
Similar work is carried out with isotopes of carbon. Carbon 14 (14C) is famous for its use in dating because it undergoes radioactive decay, and the early parts of ice cores can be be dated in this way. However, there are two non-radioactive, or stable, isotopes of carbon 12C and 13C. These have different effects on chemical and biological reactions, similarly to δ18O, which can tell us about sources of carbon in the atmosphere of the day.
In practice, the samples we work with are usually carbon dioxide, or CO2, which gives us several likely combinations of stable isotopes of carbon and oxygen:
| 16O | 16O | 18O |
| 16O | 16O | 16O |
| 12C | 13C | 12C |
| 44 | 45 | 46 |
This means we can discover information about the temperature of ancient oceans and the sources of ancient carbon in carbon dioxide from the samples of CO2 from air trapped in different parts of an ice core. This allows us to see how ocean circulation patterns, carbon sinks and a whole host of other systems changed as previous ice-ages came and went over hundreds of thousands of years. This will help predict how adding greenhouse gases to the atmosphere today will go on to affect the earth in future.
How can carbon emissions be weighed?
You'll often hear about a power station emitting several million tonnes of carbon dioxide (CO2) in one year. But how can carbon emissions be weighed?
No one weighs the gas that comes out of the chimney! But the relationship between the weight of carbon and the weight of CO2 that is produced by burning it has been established in experiments many years ago. Every carbon atom burned will produce one CO2 molecule. An oxygen atom weighs 1⅓ times as much as a carbon atom, so a carbon dioxide molecule weighs 2 x 1⅓ + 1 = 3⅔ times as much as a carbon atom.
Power stations record how much coal they burned each year, and determine the carbon content of the coal (carbon content typically ranges from 60% to over 80%, depending upon where it is mined). So if a power station burns 1 million tonnes of coal which is 70% carbon, that's 700,000 tonnes of carbon which produces around 2.5 million tonnes of CO2.
The burning of fossil fuels, not only coal, but also oil and gas, produces CO2. Worldwide, more than 8 billion tonnes of carbon are burned per year. Based on the above calculation, nearly 30 billion tonnes of CO2 are produced per year, which is significantly changing the atmosphere.
What are ppm and ppb?
PPM and PPB are units used in atmospheric chemistry to describe the concentration of gases.
PPM stands for parts of gas per million parts of air, and PPB is parts per billion. If that's not easy to imagine, try these examples:
Part per million (ppm):
- 1 second in just under 2 weeks.
- 1 litre of water in a swimming pool.
Part per billion (ppb):
- 1 second in 32 years.
- 1 ml of water in a swimming pool (that's about the size of a sugar cube).
Part per trillion (ppt):
- The size of a newspaper compared to the whole of New Zealand
- 15 cents compared with the whole New Zealand economy
The reason gases are measured at these levels is that a small amount of some gases can have a very large effect, and if you want to study how these levels are changing over time, you need make very sensitive measurements.
Is pastoral agriculture carbon neutral?
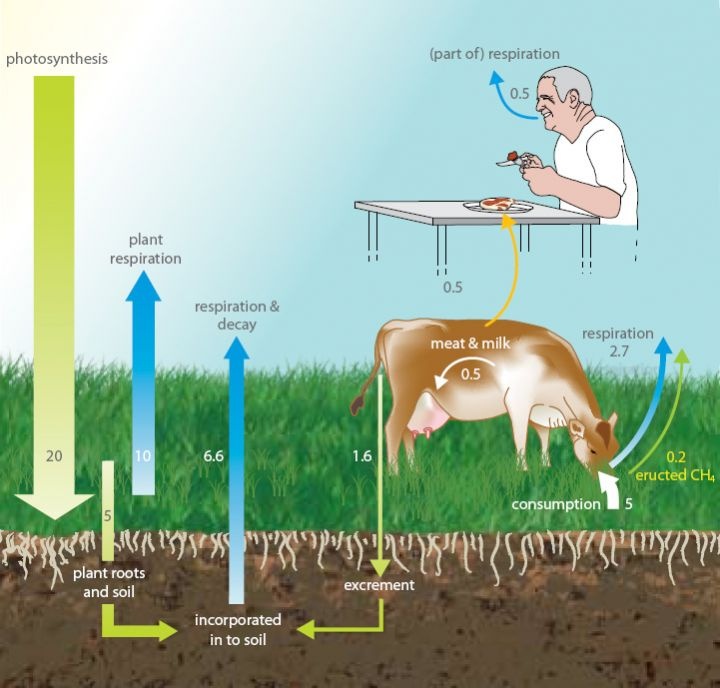
You might think that because all the carbon in cattle farming comes from the grass that the cattle is fed on, then the beef produced should be carbon neutral. Although the carbon is recycled, some of it is recycled as methane (CH4) which is a more powerful greenhouse than carbon dioxide (CO2). Not all carbon compounds have the same effect on the atmosphere.
Photosynthesis is the process plants use to take sunlight, water and carbon dioxide, and convert it into plant matter.
In the photosynthesis that occurs in the growth of pastures used for grazing livestock, about 1% of the converted CO2 is belched back into the atmosphere as CH4 by cattle during digestion. As a greenhouse gas, CH4 is 25 times more potent than CO2 (see Global Warming Potential). Pastoral farming is not carbon neutral due to the amount of CH4 cattle emit into the atmosphere. Pastoral farming's carbon footprint is increased further by the presence of nitrous oxide (N2O), which is produced in soil from the nitrogen deposited as animal excrement and fertiliser.
The following diagram shows that the CO2 flows from the atmosphere to the soil and is respired back again in its original form. A small amount of CO2 is converted as CH4 and belched out.
What are ‘Global Warming Potentials’ and ‘CO2 equivalent emissions’?
The Global Warming Potential (GWP) of a greenhouse gas is its ability to trap extra heat in the atmosphere over time relative to carbon dioxide (CO2). This is most often calculated over 100 years, and is known as the 100 year GWP.
The GWP depends on two things: how effective the gas is at trapping heat while it's in the atmosphere, and how long it stays in the atmosphere before it breaks down. For example, methane (CH4) breaks down quite quickly, the average methane molecule stays in the atmosphere for around 12 years. On the other hand CH4 traps heat more effectively than CO2, which has a much longer lifetime.
GWPs allow us to answer the question: if 1kg of a particular greenhouse gas traps a certain amount of heat, how much CO2 would trap the same amount? The 100 year GWP of methane is 25, therefore if 1 tonne of methane was released into the atmosphere, it would create the same warming as 25 tonnes of CO2. This is often described as 25 tonnes CO2e, where e stands for equivalent.
Having a common scale for all greenhouse gases allows comparisons between emissions from different activities or sectors. This helps us to decide how much effort should be put into reducing the levels of different greenhouse gases, and allows emission-reducing strategies that target different gases while minimising the economic impact.
What do ‘carbon neutral’ and ‘carbon footprint’ mean?
Many activities in people's daily lives lead to an increase in greenhouse gases in the atmosphere. Either directly, like flying, or indirectly, such as the energy it takes to produce products that we buy. Greater public consciousness about the problem has led to people making efforts to avoid or minimise the flow of these gases, such as carbon dioxide, methane and nitrous oxide, into the atmosphere.
A carbon 'footprint' is a way of describing what amount of greenhouse gases were added to the atmosphere as a result of some activity, as measured in the equivalent amount of carbon dioxide (CO2e). For example, the carbon footprint of someone who drives a petrol-fuelled car to work will be larger than for someone who uses a bus to travel the same distance, because the car driver is responsible for more CO2e emissions than the bus commuter.
A carbon neutral activity is one that has a carbon footprint of zero. Some activities which produce a lot of greenhouse gases are sometimes linked to others which reduce the levels of greenhouse gases in the atmosphere, such as switching land over to growing trees. This is known as carbon offsetting, and is one way activities or products can be presented as 'carbon neutral'.
In some cases, an activity's carbon footprint includes all of the emissions produced in its life cycle. This is known as Life Cycle Analysis.
What is the greenhouse effect?
The greenhouse effect is a warming of the earth's surface and lower atmosphere caused by substances such as carbon dioxide and water vapour which let the sun's energy through to the ground but impede the passage of energy from the earth back into space.
A simplified diagram illustrating the greenhouse effect (based on a figure in the 2007 IPCC Science Assessment) is available to the right.
Energy emitted from the sun ("solar radiation") is concentrated in a region of short wavelengths including visible light. Much of the short wave solar radiation travels down through the Earth's atmosphere to the surface virtually unimpeded. Some of the solar radiation is reflected straight back into space by clouds and by the earth's surface. Much of the solar radiation is absorbed at the earth's surface, causing the surface and the lower parts of the atmosphere to warm.
The warmed Earth emits radiation upwards, just as a hot stove or bar heater radiates energy. In the absence of any atmosphere, the upward radiation from the Earth would balance the incoming energy absorbed from the Sun, with a mean surface temperature of around -18°C.
The presence of "greenhouse" gases in the atmosphere, however, changes the radiation balance. Heat radiation (infra-red) emitted by the Earth is concentrated at long wavelengths and is strongly absorbed by greenhouse gases in the atmosphere, such as water vapour, carbon dioxide and methane. As a result, the surface temperature of the globe is around 15 °C on average, 33 °C warmer than it would be if there were no atmosphere. This is called the natural greenhouse effect.
And the enhanced greenhouse effect?
If extra amounts of greenhouse gases are added to the atmosphere, such as from human activities, then they will absorb more of the infra-red radiation. The Earth's surface and the lower atmosphere will warm further until a balance of incoming and outgoing radiation is reached again (the emission of infra-red radiation increases as the temperature of the emitting body rises). This extra warming is called the enhanced greenhouse effect.