PDF of this article (283 KB)


NIWA research helps energy producers assess risk and devise risk-management practices. Craig Thompson, Tom Clarkson, and Warren Gray outline some of the ways NIWA contributes.
Risk management is the process of assessing the likely impacts of hazards on things that matter, and finding ways to cope. This broad definition can be applied in many fields of management, from environmental management through to asset and financial management. The aim is to make informed decisions on how to best minimise exposure to the hazards.
An essential aspect of risk management is the process of assessing the risk – what is the chance of some adverse event occurring and what is the magnitude of the effects? For example, concrete hydroelectric dams in New Zealand are subject to a range of natural hazards: flooding is one of the more prominent hazards. Dam spillways are intended to pass floods safely and historically have been designed to cope with a 1-in-500-year flood extreme. If the economic life of a dam is 200 hundred years, there is a 33% chance of at least one 500-year flood within that period. However, if the dam owner is only willing to accept a 10% risk during its lifetime, the spillway needs to be designed to cope with a larger and much less frequent flood event.
Natural hazard risks in the energy sector
How does NIWA help the energy sector in the risk-assessment and management process? Our scientists have undertaken a wide range of risk assessment studies to provide detailed information and tools to assist in effectively managing the risk.
- Design of flood and low-flow studies and the changes in risk due to natural variation in our climate (see 'Climate variability, climate change, and energy').
- Analysis, interpretation, and assessments of risk of severe weather events and other hazards. NIWA undertook a detailed analysis and assessment of the impacts (and risks) of the February 2004 storm over the southwest of the North Island for an electricity lines company.
- Dispersion and modelling studies of gaseous contaminants and particulates from generator exhaust stacks and cooling towers, for both fossil fuels and geothermal sources.
- Assessment of wind and scour risk to power pylons that are affected by flooding and slips (see box below, 'Preventing falling power pylons').
- Surveys of carrying capacity of transmission lines, including:
- studies to identify when and where extreme high temperature conditions could potentially affect the supply of electricity along transmission lines;
- meteorological monitoring support for aerial surveys along transmission lines (see box below, 'Supporting surveys of transmission lines').
Including risk assessment in energy planning and operations helps to ensure resilience to natural hazards and continuity of energy supply.
Risk terminology
Risk: the chance that an adverse event will happen and the impact of that event. Risk = Probability x Impact
Impact: the effect of an adverse event.
Risk management: the process of assessing risk and determining how best to manage it.
Risk assessment: the process of assessing the magnitude of the potential loss, and the probability that the loss will occur.
Preventing falling power pylons
NIWA scientists have created a risk-assessment tool for Transpower to identify which power pylons are most at risk from flooding and slipping. For example, a pylon on a steep grassy slope is more at risk from slipping and scouring than one on a flat, tree-covered hilltop. Similarly, a pylon that stands on the flood plain of a major river is more at risk than one well away from any watercourses.
The risk-assessment tool combines information about land cover (grass or trees), hill slope, proximity to rivers, and the size of the rivers. It uses GIS (geographical information system) layers so the different aspects can be mapped, and the risk to each pylon around the country assessed. Pylons are categorised as to how extreme each of these parameters are, and then ranked in order of risk. The system was evaluated by comparing its results at pylons already known to be at risk.
Supporting surveys of transmission lines
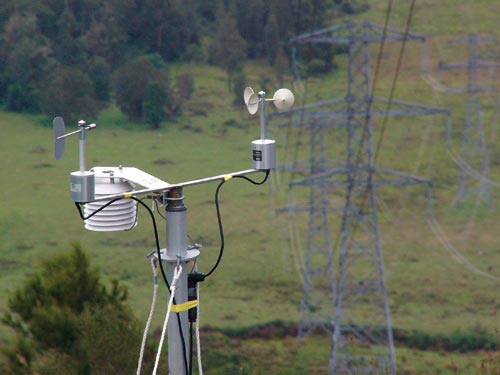
NIWA has provided meteorological support for Transpower’s aerial surveys of its high-voltage transmission lines. Since higher currents increase the temperature and the sag of the lines, the surveys determined the precise location of the lines relative to the ground and vegetation and estimated the maximum current capacity of the lines.
Specialist aerial laser surveying companies carried out the helicopter-based surveys. The exact position of the electrical conductors depends not only on expansion due to heating from electrical current, but also on heating by sunlight and cooling by wind. With the requirement for the weather to be known at every cable span as the survey helicopter passes, NIWA provided meteorological support for the surveyors by making measurements every 10 or 20 kilometres along the survey route. The data collected were used for high-resolution 3D meteorological modelling for each of the cable spans being surveyed.
Craig Thompson is group manager for NIWA’s Climate Services. Dr Tom Clarkson works with atmospheric emissions, and Dr Warren Gray works in meteorology and remote sensing. They are all based at NIWA in Wellington.
Teachers’ resource for NCEA AS: Science 90191 (1.6), 90313 (2.2). See other curriculum connections at www.niwa.co.nz/pubs/wa/resources