
Retrospective river flows - March to May 2010
15 June 2010
Retrospective river flows information for the three months March to May 2010.
Our last three-monthly predictions and what actually happened
What we predicted March to May 2010 What actually happened

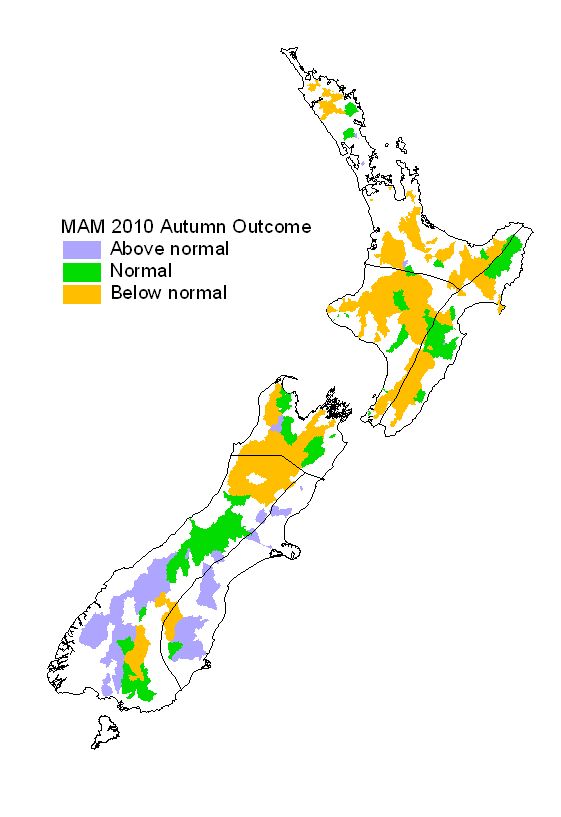
Interpreting the above maps
Percentage chance of:

The above ‘What we predicted’ map (left) shows predicted conditions for the season (any contiguous three-month period) as a whole, and should not be interpreted on a month-by-month basis. Included on the maps are estimated probabilities that the forecast seasonal river flows will occur, shown as a percentage chance of occurrence in the range of each tercile (one third) of all historic observations for the season.
The outcome map (right) shows the actual tercile that eventuated for each catchment for which data was received.


