This unique project is the first systematic attempt to quantify and map environmental values of New Zealand's coastal marine ecosystem.
It uses existing data sources to create a series of spatially explicit data layers. The information has applications in biosecurity, conservation, and coastal management.
The issue
New Zealand’s coastal environment is home to an estimated 65 000 species. Many are unique to New Zealand, making it a hotspot for marine diversity worldwide. These species and their associated ecosystems deliver a wide range of environmental services to New Zealand. This includes providing the underlying productivity to sustain considerable fishing, aquaculture and tourism industries.
Coastal environments worldwide are becoming increasingly threatened by human activities, such as coastal construction and shipping. Threats associated with shipping include the introduction of non-native species and pollution from fuel and oil spills.
In order to minimise the impacts of such threats, coastal managers need to know the distribution of coastal species assemblages and habitat types, This is particularly important for vulnerable or rare species and habitats.
In a biosecurity context, this information helps identify which native species and habitats may be affected by new incursions of alien species.
There has been no previous attempt to map or estimate the value of New Zealand’s marine environment in a consistent or comprehensive way to enable effective management.
Our approach
In 2008, NIWA carried out a study to assess the perceived value of New Zealand’s coastal marine environment for Biosecurity New Zealand (MAFBNZ). This was part of a wider project to assess the social, economic, cultural, and environmental values of the New Zealand coast.
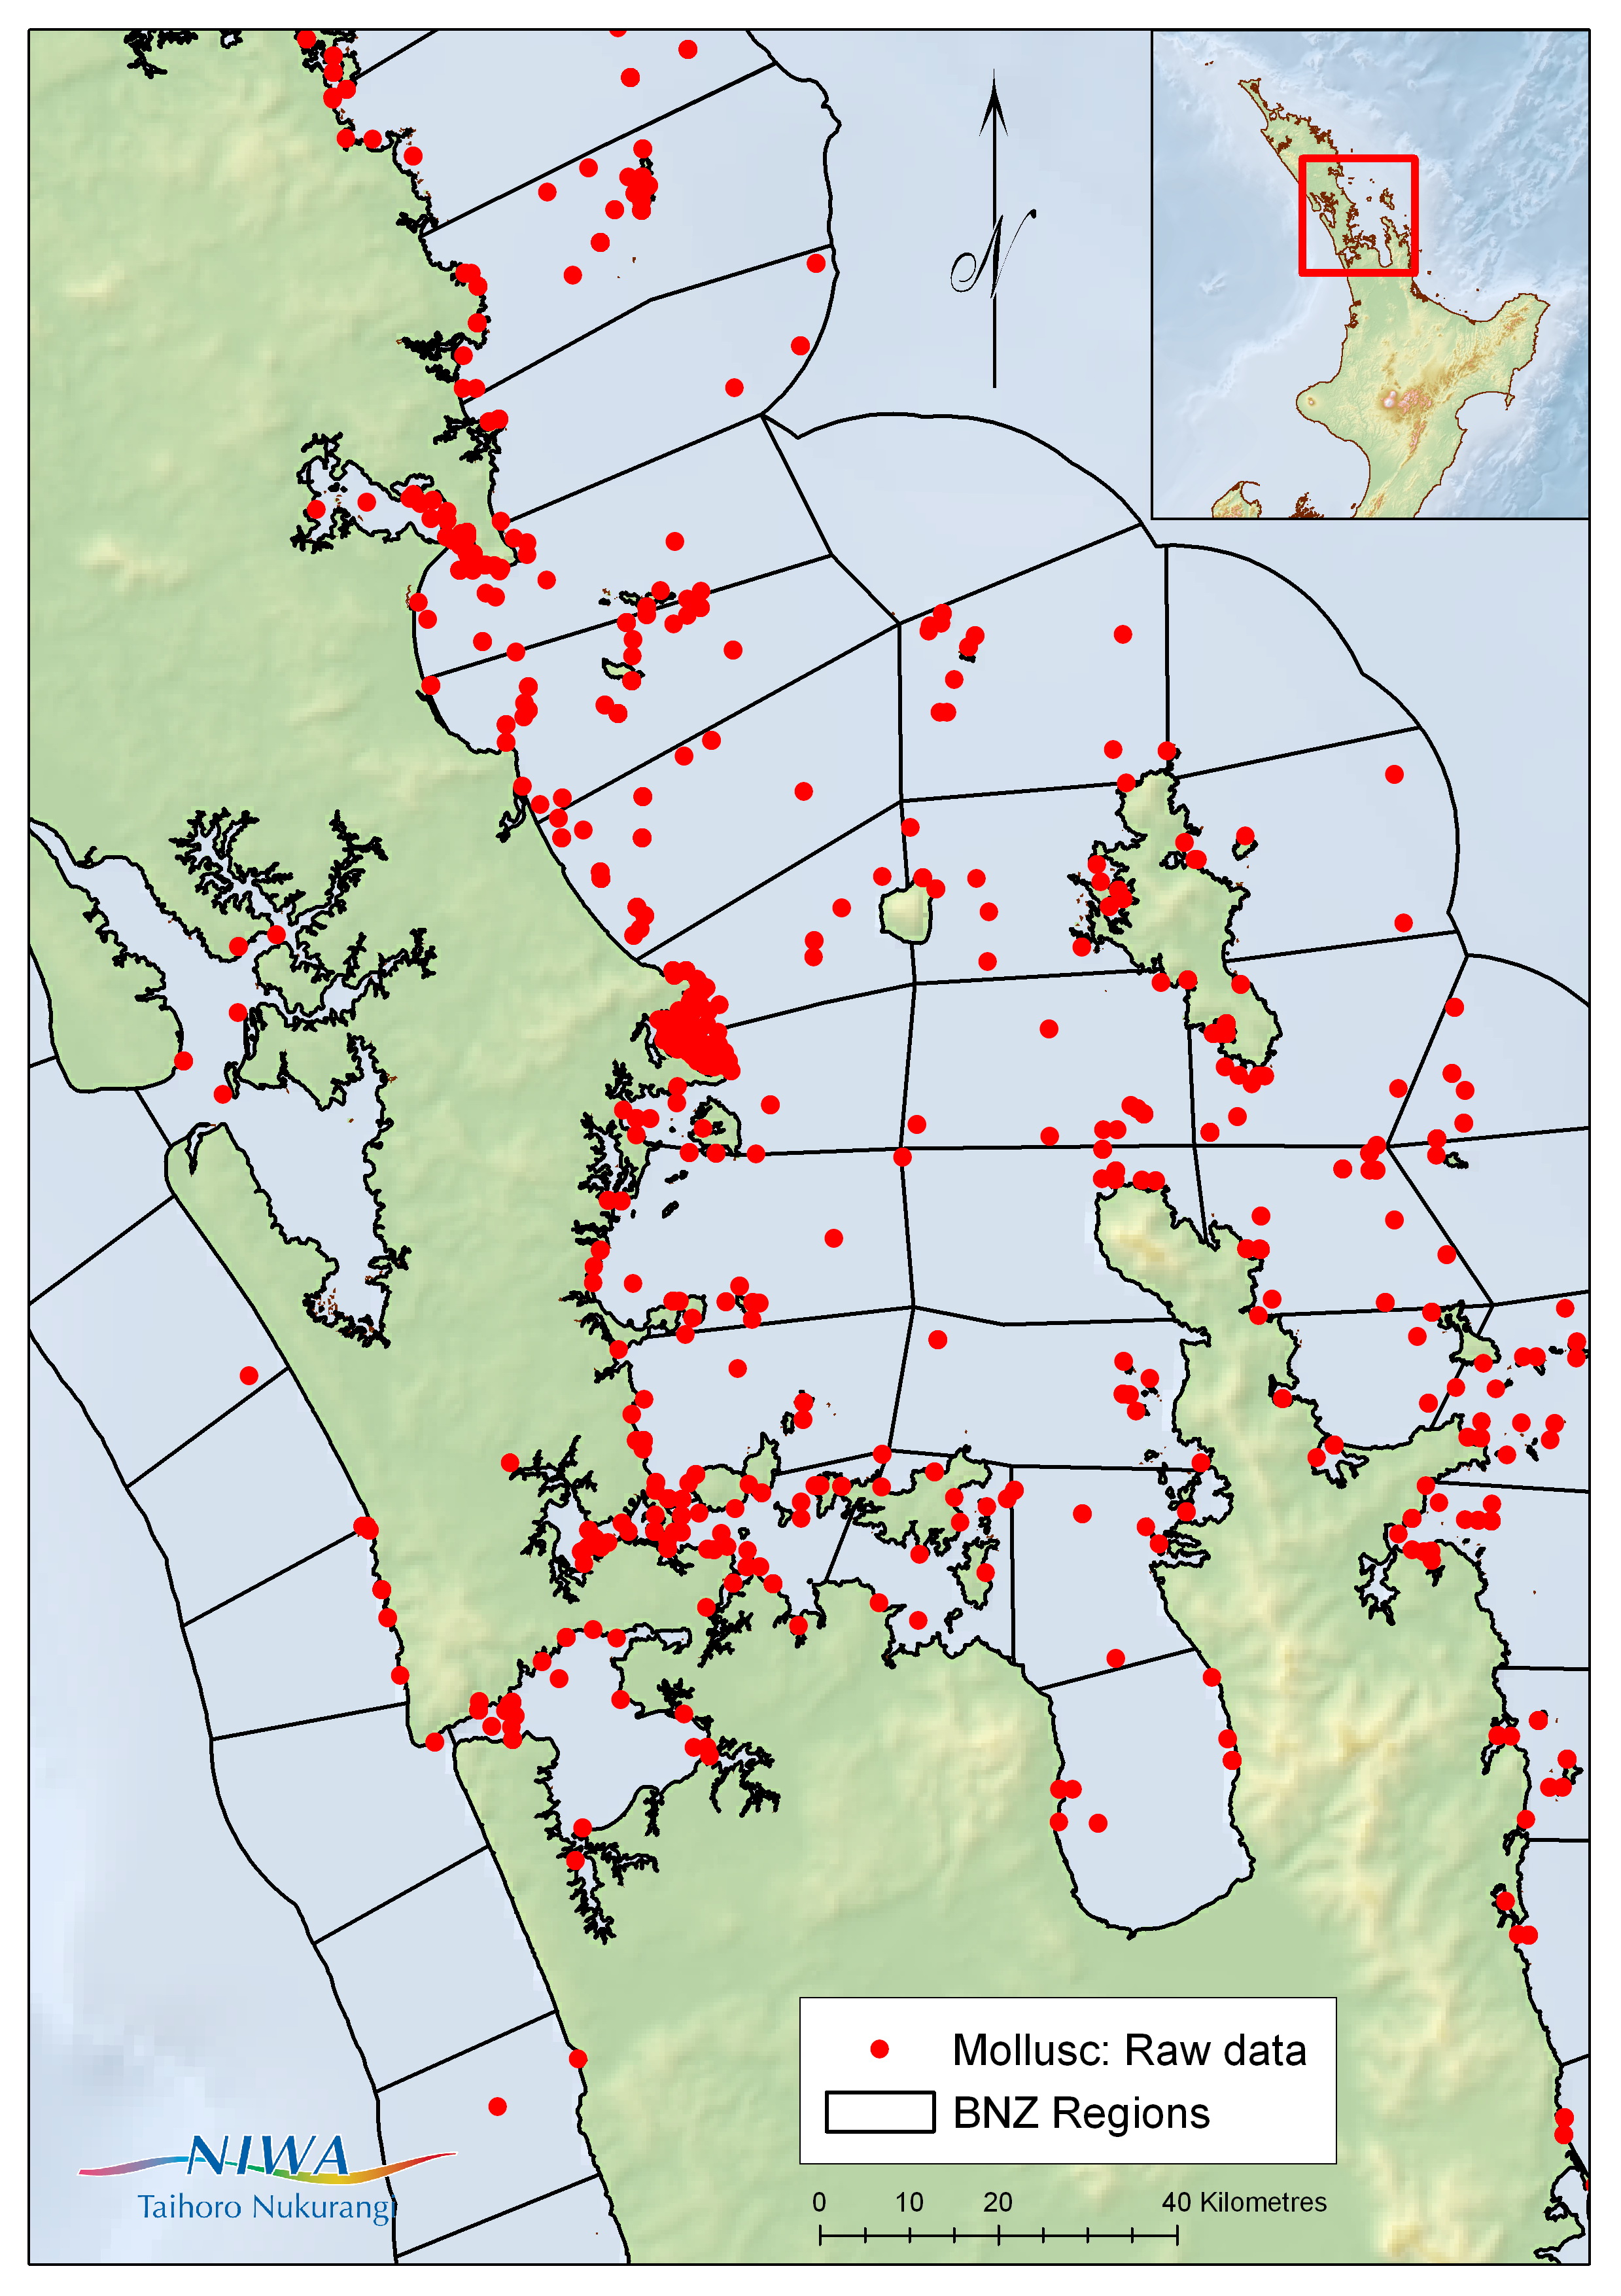
We gathered existing sources of nationwide environmental data and information, including personal observations, museum records, and detailed scientific survey data. These were obtained from a variety of sources, including: NIWA, Te Papa, the Department of Conservation, the New Zealand Ornithological Society, and private consultants.
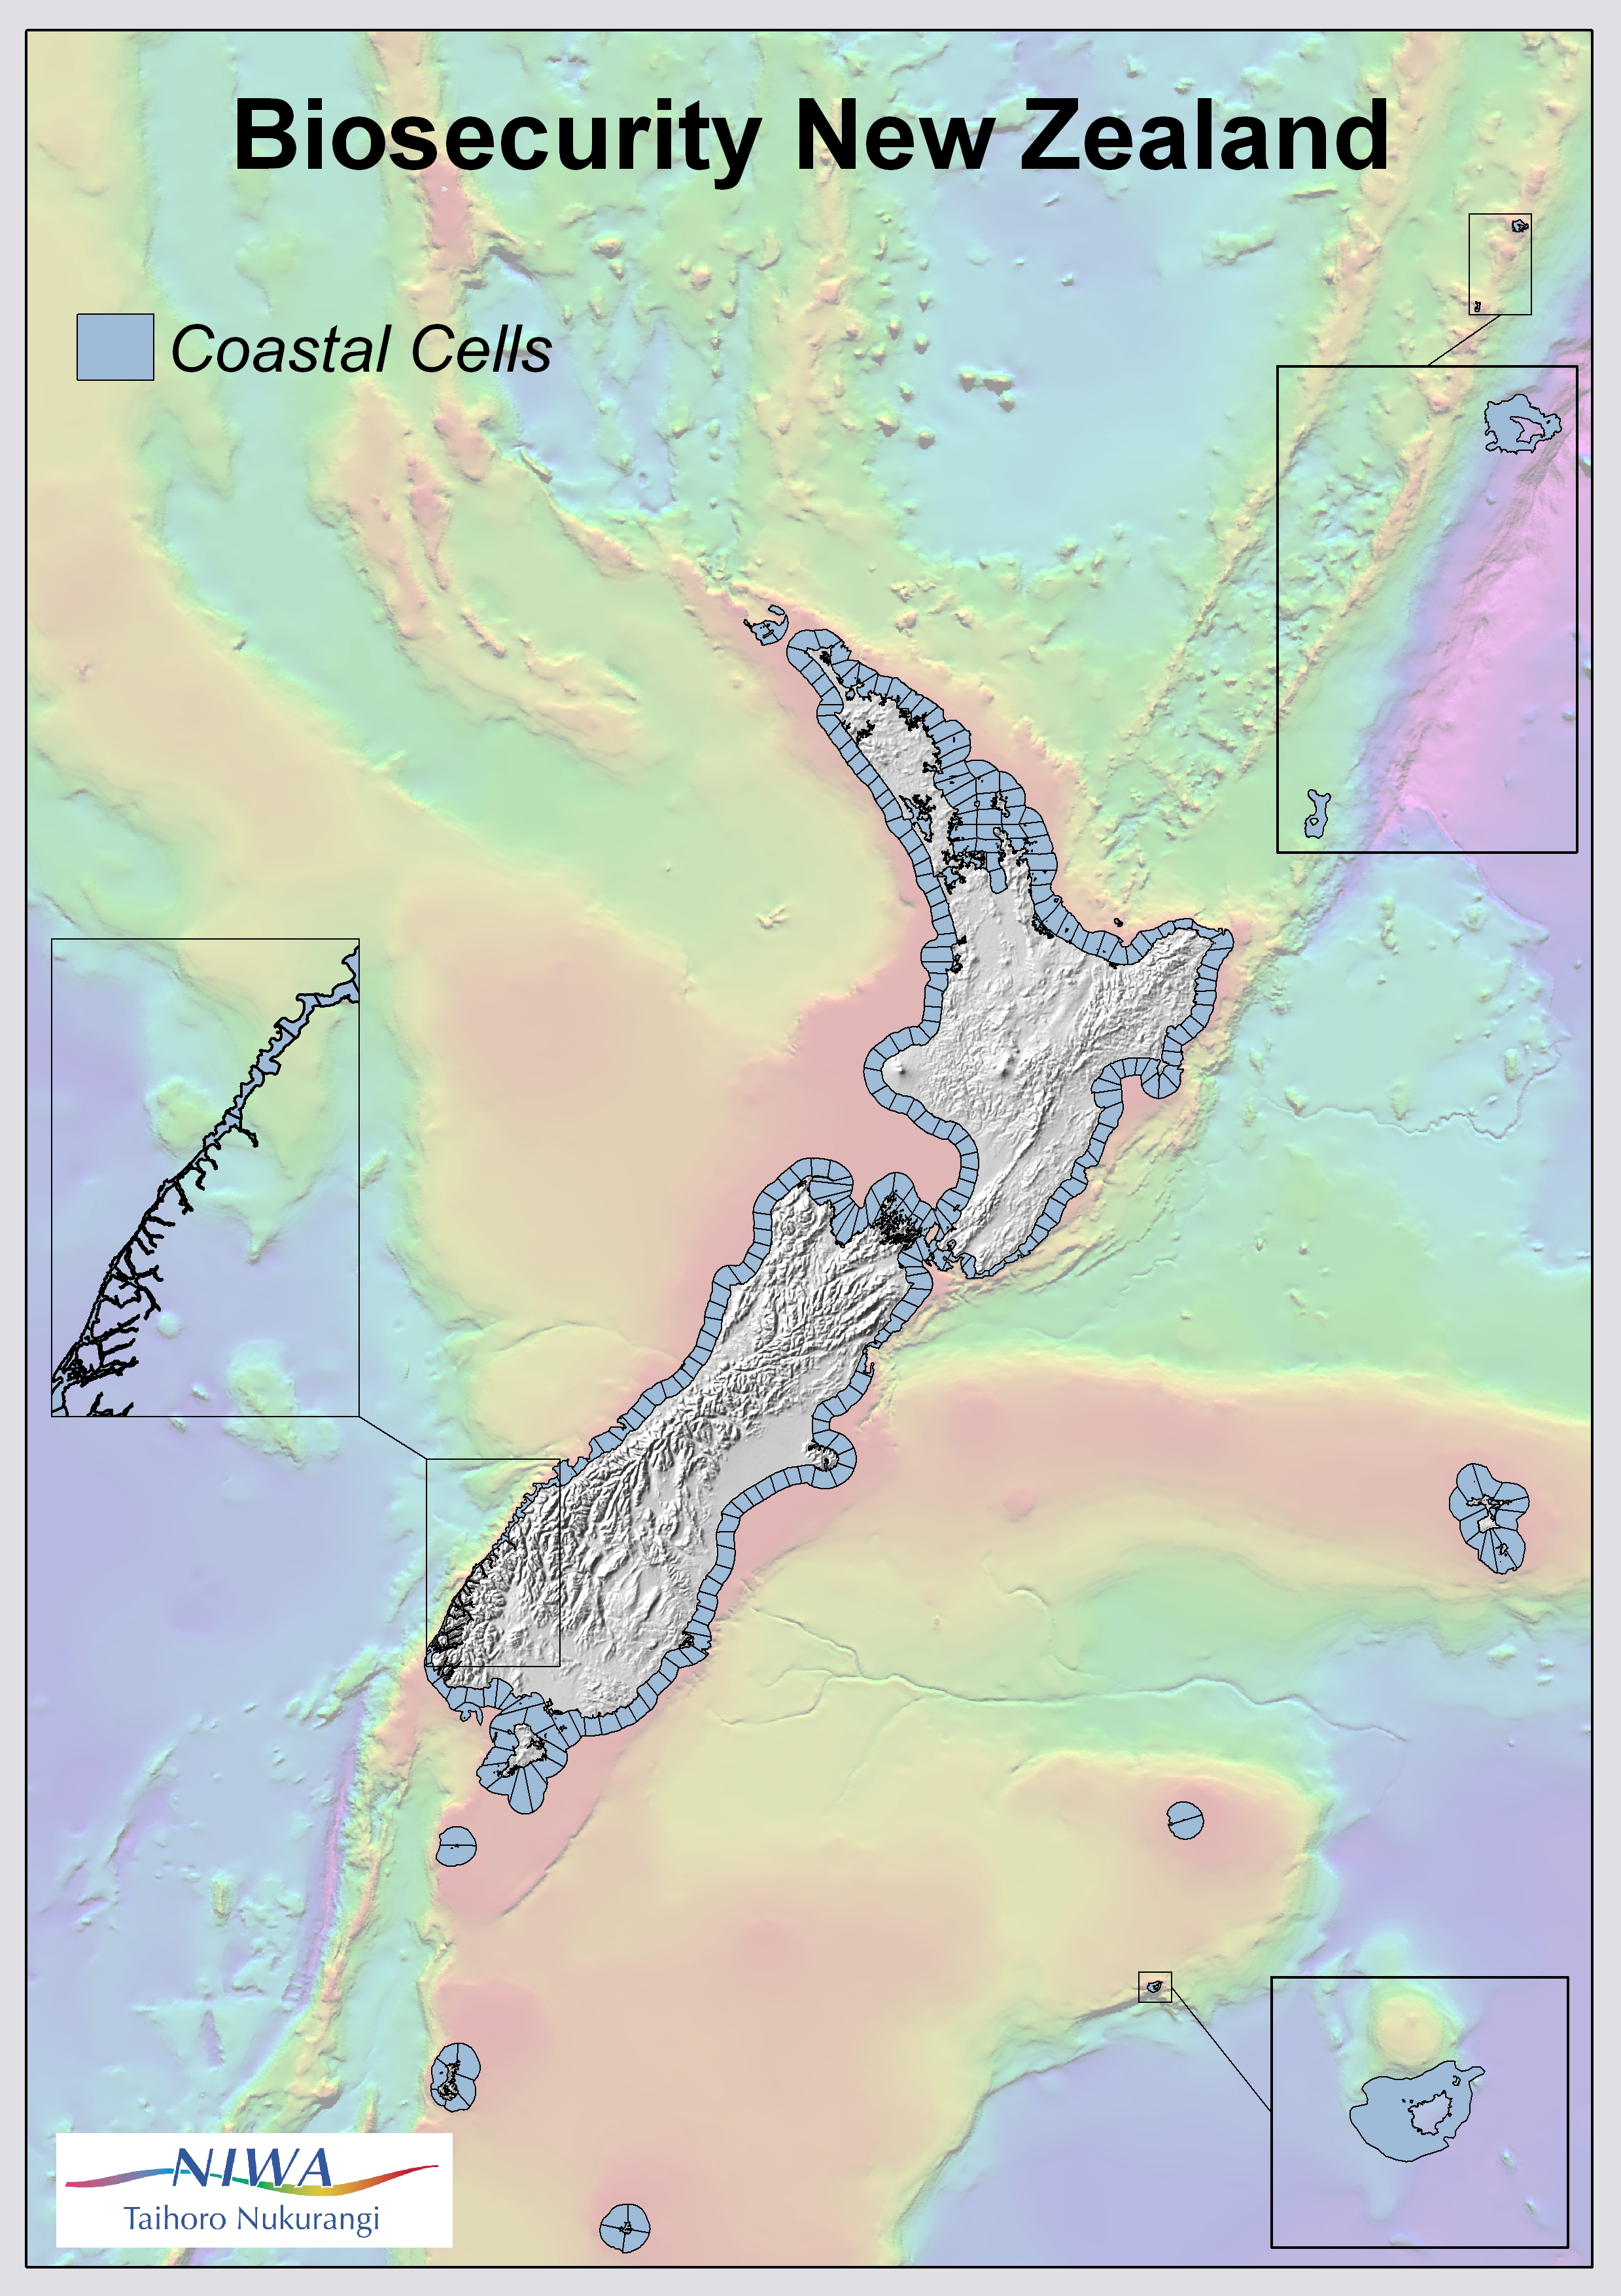
From these data, we estimated a variety of biological and environmental values for each of 300 pre-determined coastal cells around the New Zealand coastline. We used the values to populate a spatially explicit database comprising 230 geographic information system (GIS) layers.
A subsequent meta-analysis of these individual layers generated summary layers to identify key trends in the distribution of diversity of both organisms and habitat of the New Zealand coastal environment.
Results from this meta-analysis will be used alongside similar maps of cultural, social, and economic values around the New Zealand coastline. This will assist effective coastal management in the event of an environmental threat, such as an incursion of an alien species.
Results
A total of 26 datasets were used to create 230 layers of spatially explicit environmental information within a geographic information system, from which maps of the New Zealand coastal zone (including offshore islands) can be generated.
Biological attributes mapped for each coastal cell include:
- number of data records available
- number of species recorded
- estimated species richness
- average taxonomic distinctness (ATD)
- variation in ATD
- number of rare species
- an estimate of the similarity of biological communities between coastal cells.
Habitat attributes mapped include:
- distribution of habitat types around the New Zealand coastline
- percentage of each habitat present within each coastal cell.
Meta-analysis
A meta-analysis of these data was carried out using a ranking system. This generated first-stage summary maps which combined all the information available for each of the 26 datasets.
First-stage summary map: Estimated reef fish diversity (JPG 546 KB)
A high ranked value represents an area of high diversity. First-stage summary maps were then combined to create three second-stage summary maps:
- mean ranked values across all taxon-specific data
- mean ranked values of all at-risk and threatened birds and invertebrates
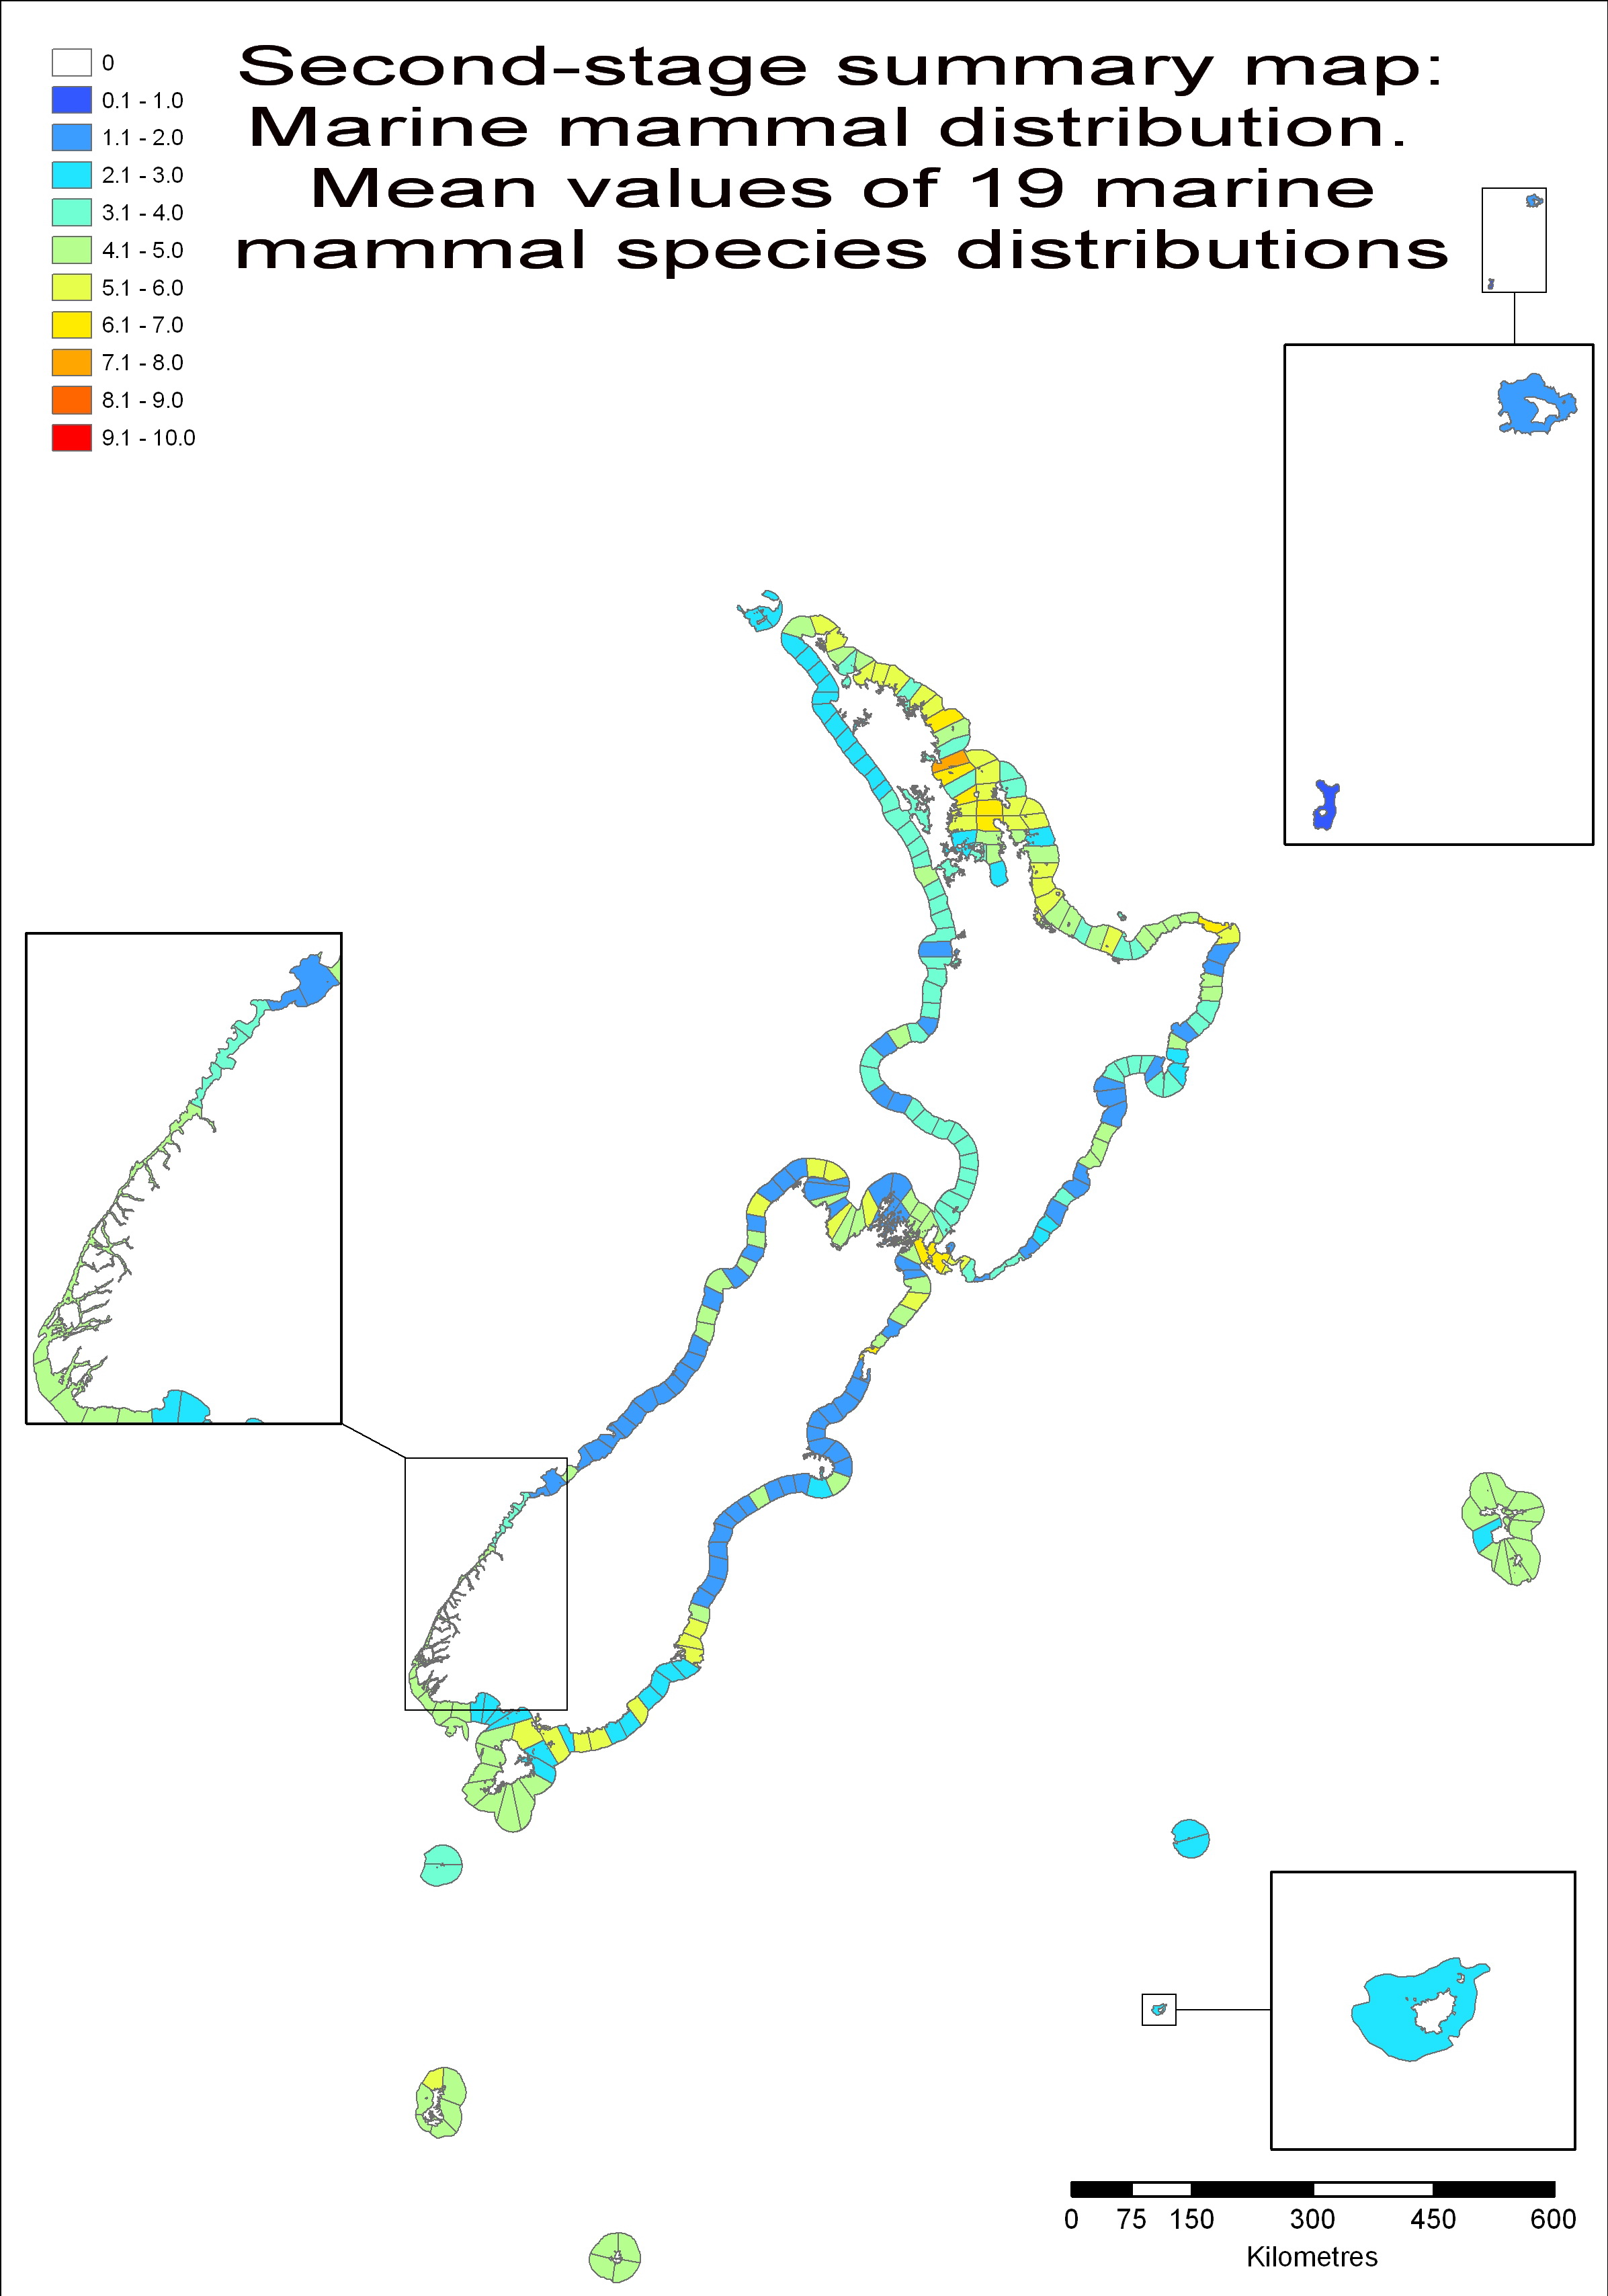
- mean ranked values of marine mammal distribution data.
Second-stage summary map: Mean mammal distribution (JPG 618 KB)
These second-stage summary maps were combined to create third-stage summary maps of all biological data and all habitat data. A final-stage analysis combined both biological and habitat data into one overall summary map.
Third-stage summary maps: Habitat data (JPG 633 KB)
Outputs
This project has produced two MAFBNZ technical papers, available on the MAFBNZ website by clicking the links below.
Environmental Value Mapping: Supplementary information to MAF Biosecurity New Zealand Technical paper 2008/16. (PDF 376 KB)
External People Involved
Daniel Kluza (MAFBNZ)

