
February's climate
New Zealand climate in February
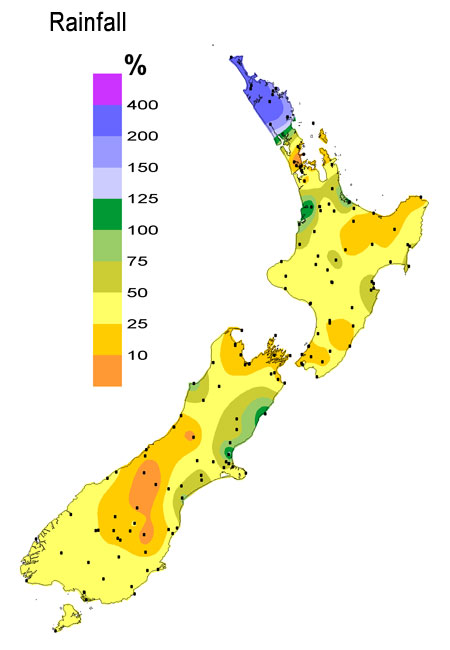
Rainfall (click to enlarge).

Temperature (click to enlarge).
February was unusually dry over much of New Zealand. Ranfurly in North Otago had no measurable rainfall in February, and just 1% of normal rainfall was recorded at Lake Tekapo, making it the driest February there in over 80 years. The exception to the dry conditions was in Northland where three days of heavy rain caused flooding.
The national average temperature of 17.0 °C was 0.2 °C below normal.
For more information on the climate in Februar 2007, visit the climate summaries page at www.niwascience.co.nz/ncc/cs/mclimsum_07_02
Wide spread low soil moisture Soil moisture (click to enlarge). Soil moisture levels over much of the country were much drier than normal at the end of February. Moisture deficits of at least 130 mm were reached in all eastern regions from Gisborne to Central Otago, as well as in Auckland, Waikato, Eastern Bay of Plenty, Wanganui, Manawatu, Wellington, and Nelson. Deficits of 110 mm or more were also widespread. |
High flows in Northland River flows (click to enlarge). February stream flows were above normal in the far north, normal in Waikato and coastal Canterbury, and generally below normal elsewhere. |
December to February: the climate we predicted and what happened
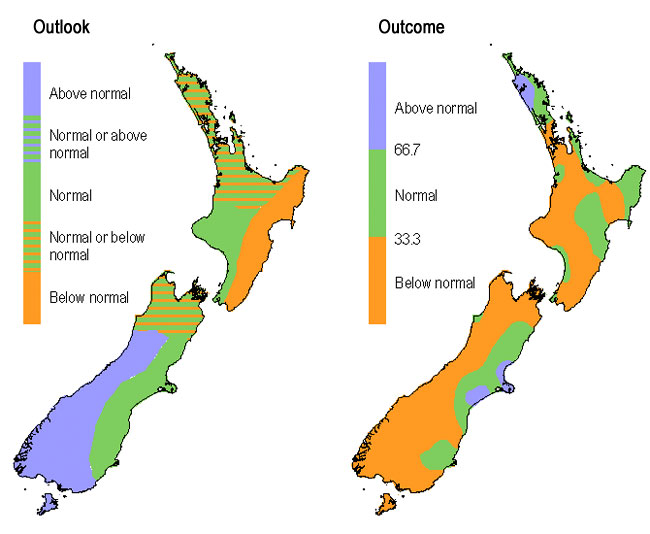
(click to enlarge).
Rainfall
Rainfall in the North Island, apart from Northland, and in the north and much of the east of the South Island, was normal or below normal as predicted. The west and south of the South Island were drier than expected

(click to enlarge).
Air temperature
Air temperatures were higher than expected in the west of the South Island, and lower than expected in the north and east of the North Island. Elsewhere temperatures were correctly forecast.
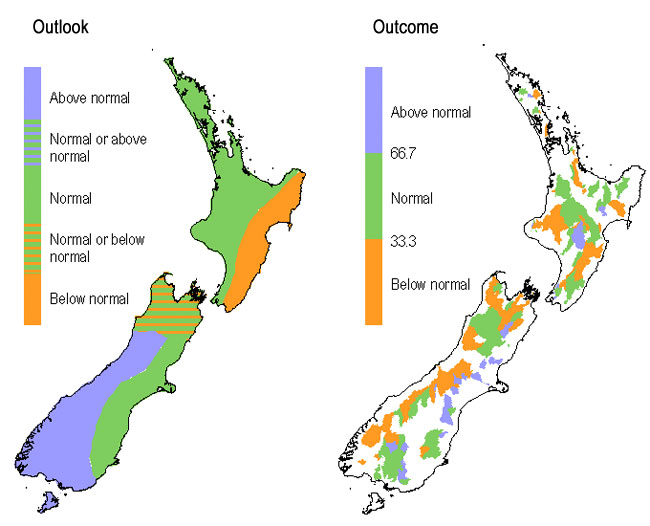
(click to enlarge).
River flows
North Island stream flows were below normal to normal, in line with predictions. In the South Island stream flows flows were below normal in the north as predicted, but lower than expected in the west and south.
The three outcome maps give the tercile rankings of the rainfall totals, mean air temperatures, and mean river flows that eventuated from December to February, in comparison with the forecast conditions.
As an approximate guide, middle tercile rainfalls typically range from 80 to 115% of the historical normal, and middle tercile temperatures range about the average by plus or minus 0.5 °C.