
Checkpoint
Outlook and outcome – January 2004 to March 2004
Rainfall was as forecast for parts of Northland and the southern South Island. In other districts, while January and March rainfalls were generally in line with predictions, rainfall totals for the three months were dominated by the February storms, especially over the southwest North Island and northwest South Island, where totals were well above normal.
Air temperatures were lower than predicted in most districts, although the east was warmer than the west, as signalled by the forecasts.
A sequence of severe February floods gave exceptionally high streamflows for most of the North Island apart from the Bay of Plenty, East Cape, and northern Hawke’s Bay regions where normal or above normal flows occurred. In the South Island, river flows were normal to above normal in the west, normal in the north, and below normal in the east and south.
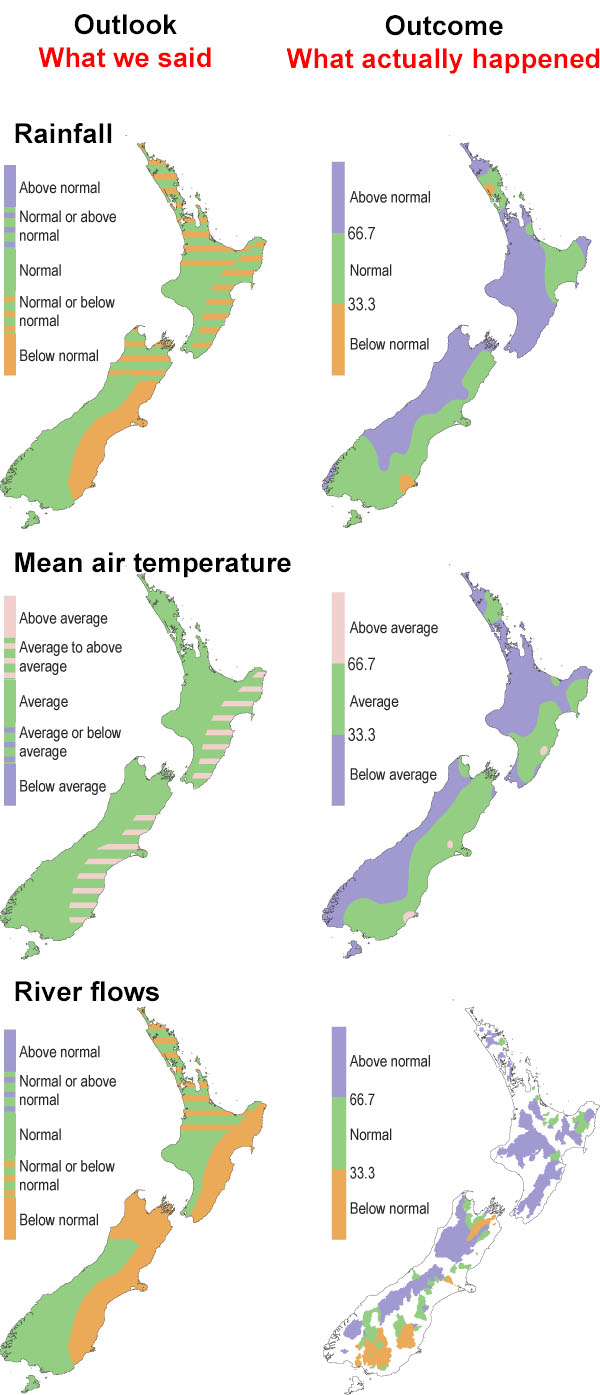
The outcome maps shown here give the tercile rankings of the rainfall totals and mean temperatures that eventuated for these months. Terciles were obtained by dividing ranked January to March data from the past 30 years into three groups of equal frequency (lower, middle and upper one-third values) and assigning the data for the present year to the appropriate group. (Click to enlarge)
As an approximate guide, middle tercile rainfalls often range from 80 to 115% of the historical average. Middle tercile air temperatures typically occur in the range of the average plus or minus 0.5°C.