
Backgrounder
Backgrounder
What is the UV (ultraviolet radiation) index?
The UV index is a standard measurement of erythemal (sunburn-causing) UV intensity that gives a more objective measure than the old “time to burn” (which cannot account for skin tone).
The UV index scale is open ended, but the larger the number, the more intense the UV. A UV index of greater than 10 is extreme and a UV index of less than 1 is low.
In New Zealand, its maximum summer value is generally about 12, but it can exceed 13 in the far north. In winter, it reaches peak values of 1 in the south or 2 in the north.
For most of us, a UV index of 4 or above means that protection from the sun is important, especially for long periods of exposure between 11 am and 3 pm during summer. Additional UV and ozone information.
Global UV index link
The UV index used in New Zealand is part of the World Health Organization’s Global UV Project, known as Intersun.
Intersun has introduced an internationally agreed communication concept to harmonise reporting of the UVI worldwide and to improve its use as an educational tool.
UV forecast adding more science to sport
Richard McKenzie, NIWA
Sports enthusiasts in New Zealand are increasingly conscious of the need to protect themselves from excessive exposure to UV radiation. NIWA forecasts of daily UV risk were on display at a recent major South Island sporting event.
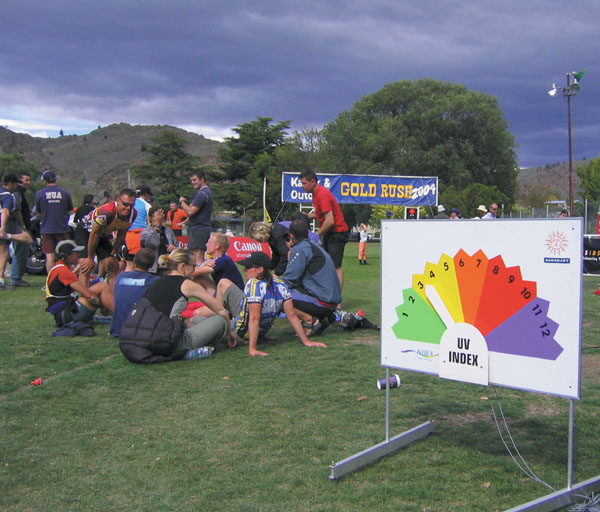
The NIWA UV-risk portable display at the Goldrush staging posts.
The 3-day, 475 km Goldrush multi-sport event, based in Alexandra and encompassing wide tracts of backcountry Central Otago, has become an annual icon event in the New Zealand multi-sport calendar. This year the competition, now in its eighth year, attracted a record 500 entries over Otago Anniversary Weekend (20–22 March).
NIWA helped to raise the awareness of UV risk to contestants by providing a UV forecast as part of the pre-race briefing, and by making a real-time display of daily UV forecasts available at key staging posts of the event. Contestants showed a lot of interest in the display and its highlighting of UV health issues. Subsequent observations found the forecasts to be accurate.
The prototype UV display had been constructed at the NIWA research campus in Lauder, Central Otago, and tested over the summer.
Daily updated forecasts and monitoring of UV and ozone over New Zealand are available on the NIWA website (see right). Also on this web page are daily updates of graphs showing predicted and measured UV index at Leigh, Paraparaumu, Christchurch, Lauder, Invercargill, and Rarotonga.


Examples of the forecasts of ozone thickness (left) and UV index (right) for New Zealand that are published daily on the NIWA website. Part of the UV spectrum is absorbed by the ozone layer in the atmosphere. NIWA monitors ozone thickness to help determine UV risk.

Sunset over Wellington. (Photo: Alan Blacklock)