
Backgrounder
Backgrounder
2002 rainfall to date
Large areas of New Zealand have received near normal rainfall. Parts of Waikato, Bay of Plenty, and the northeast and southwest of the South Island have been drier than average.
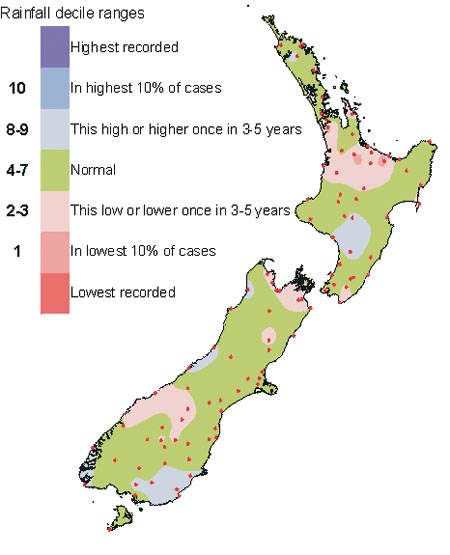
Total rainfalls for 1 January to 31 August 2002.
Update on the SOI
The mean Southern Oscillation Index (SOI) for August was -1.8, with the three month average now at -1.1. The present moderate El Niño is expected to be weaker than the 1997-98 event. Further general information on El Niño is available on the World Meteorological Organization web site. (http://www.wmo.ch)

The Southern Oscillation Index (SOI).
Estimating changing frequencies of extreme events
Winter this year was characterised by some relatively rare events, including extremes of temperature, at least three disruptive snowfalls, five damaging storms, and seven heavy rainfall/flooding events. Weather sensitive industries are concerned to know if extreme event frequencies are changing against the background of climate change, and whether these frequency changes can be estimated.
Wild winter weather
The infamous "weather bomb" in June, which brought over 200 mm of rain in less than 2 days and cut power to 20 000 homes in Waikato, the powerlines collapsing under snow around Ashburton, and the 12 metre waves battering Banks Peninsula were all rare events this winter that might have prompted the question "Is this a sign of things to come?"
Reports of recent severe floods in Europe, Korea, and China add to evidence of what might appear to be a global trend of increasing frequency of extreme events.
How can we determine whether such events are likely to occur more often (or for that matter, less often) in the future?
Changing return intervals
One of the problems with extreme events is that the intervals between them are almost never the same. It is quite possible, for example, to have two 50-year floods in, say, a five year period, and then to have no floods of that size for another 50 years. In this way, extreme events can occur in clusters. This makes prediction of the frequency of extreme events over shorter periods, say a decade or so, very difficult.
Options for determining future risk
So what then are the options for determining whether the frequency of extreme weather events is changing?
In practice, we have to look at a range of options for analysis. Each option provides part of the information we need for determining future risk. Here are some examples.
1. Data trends
The instrumental record, that is, the daily observations of the weather going back over 100 years in New Zealand, is an important resource in determining past climate trends. These data can tell us if drought is becoming more frequent, for example, or if the depth of heavy rainfall events is increasing. If we extrapolate historical data trends into the future, it gives us scenarios of what might happen.
2. Global scale climate cycles
Most of us are familiar with the El Niño-Southern Oscillation climate cycle, and the more slowly oscillating Interdecadal Pacific Oscillation, both of which affect atmospheric circulation over New Zealand and cause climate variability.
3. Climate scenarios
Climate scientists in many countries are working with Global Circulation Models that emulate how global climate patterns evolve and what happens when there are both natural and human induced changes, such as reduced forest cover, or higher green house gas concentrations.
4. Weather generators
Weather generators are computer models that statistically represent day-to-day weather patterns and events. Once the models are good enough to simulate present weather, they can be adjusted based on how the climate is expected to change over the next few decades, using stronger westerlies or higher temperatures for example. The output might show changes in climate – does it rain more or less often? Is there any change in the depth of rainfall events and their intensities?
Natural hazards
Some regional authorities in New Zealand are compiling information on natural hazards, including extreme weather. The above methods are being used to help create this information, which provides a basis for future hazard awareness and planning. NIWA and GNS (Institute of Geological and Nuclear Sciences) are addressing natural hazard concerns by launching a Natural Hazards Centre. There will be more information on this in subsequent issues of this publication.


Debutante tulips mark the arrival of spring in the Wellington Botanic Gardens. (Photo: Alan Blacklock)