
Sea levels and sea-level rise
On this page:
- How are sea levels measured?
- What is contributing to rising sea level?
- Future sea-level rise projections
- NZ SeaRise project and maps
- Will the rise in sea level be a steady increase?
- If sea-level rise is only 2–3 millimetres per year, then why worry?
How are sea levels measured?
Absolute (or eustatic) sea level represents the sea height relative to the centre of the Earth, whereas relative (or local) sea-level rise includes both the absolute sea-height change plus changes (up or down) in land height for the relevant coastal area.
Tidal gauges measure relative sea-level rise. Although such measurements do not distinguish between the ocean level that is rising and the land that is slowly sinking or rising—nevertheless it is the relative sea-level rise that local communities need to adapt to. However, co-locating a continuous GPS instrument near a tide gauge does enable the local land movement to be separated from the rising sea around New Zealand.
By knowing both the absolute mean sea level and the rate of land movement, then the combination of these two components will inform projected changes to the sea level for that region.
The shoreline at any time is defined by the spatial position of the land-sea interface upon the land surface, using the mean high water spring mark (which is the average high tide approximately every fortnight soon after a new or full moon). This level is determined by tide-gauge measurements (e.g., Standard Ports by Land Information NZ).

Tide gauges measure relative SLR:
The diagram above shows the situation where the landmass, on which the tide gauge sits, has risen over a lengthy period of years between times t1 and t2 along with a rise in absolute sea level of the adjacent ocean. For this ongoing uplift situation (e.g., parts of Scandinavia), the measured relative SLR will be smaller than the absolute change in sea level, and conversely, if the land is subsiding long-term (e.g., lower North Island), the relative SLR will be higher.
When calculating the average global SLR to date, using tide gauges from around the world, adjustments to each dataset are needed to account for the local vertical land movement.
Satellite-based altimeters measure absolute SLR:
The diagram above shows sea level being measured by altimeters installed on board orbiting satellites such as Jason 2, and the recently-launched Jason 3 in January 2016. Essentially altimeters are a pulsed radar system that detects the average sea-surface height continuously along repeat satellite-orbit tracks, approximately every 10 days, that cover the Earth from 66° latitude either side of the Equator. The satellite orbit has to be accurately tracked and its position and height is determined to a stable reference frame such as the International Terrestrial Reference Frame with its origin at the centre of mass for the Earth.
Absolute sea-level rise calculated from satellites also includes adjustments to account for the large-scale vertical movement of the Earth’s crust and ocean floor (e.g., from past glacial loading during the Ice Age) and changes in gravity by the GRACE satellite (e.g. redistribution of ice and water masses on the Earth from melting glaciers and ice sheets).
What is contributing to rising sea level?
The main contributors to the global rise in sea level since the 1900 are:
- Warming of ocean waters mostly in the upper 0 to 2000 metre depth layer. As the ocean warms the seawater expands in volume. Most of the increased seawater volume occurs as an increase in the level of the ocean, as the world’s shorelines constrain the ocean boundaries. The thermal contribution varies substantially in different ocean regions and is strongly influenced by El Niño/La Niña and longer climate cycles.
- Water mass is added to the oceans from melting or break-up of land-based ice stores such as glaciers and polar ice sheets (particularly Greenland and West Antarctica).
- Changes in water properties or flowpaths of the main ocean currents.
- Changes in the net storage of terrestrial freshwater e.g., groundwater/river extraction, reservoirs, changes in rainfall and evaporation from climate variability e.g. El Niño/La Niña.
Recent studies (e.g. Frederikse et al, 2020) have now reconciled the accounting of these contributors with measurements of sea level globally over time since 1900:
- Ice-mass loss - predominantly from glaciers - has caused twice as much global sea-level rise as has thermal expansion to date.
- Mass loss from glaciers and the Greenland Ice Sheet explains the higher rates of global sea-level rise during the 1940s
- A sharp increase in water impoundment by artificial dams and reservoirs is the main cause of the lower-than-average global sea-level rises during the 1970s.
- The acceleration in sea-level rise since the 1970s is caused by the combination of thermal expansion of the ocean and increased ice-mass loss from Greenland.
Local SLR (also called relative SLR) is also affected by the vertical land movement. This is influenced by various natural or human factors, such as:
- subsidence of large river-delta systems or from pumping of underground aquifers or oil/gas reservoirs.
- tectonic effects of uplift or subsidence arising from earthquakes or stresses between major earthquake events. More information for New Zealand can be found here.
- ongoing rebound or relaxation of the Earth’s crust following retreat of the ice sheets since the last Ice Age (or Glacial Maximum) – which scientists call glacial isostatic adjustment (GIA). NZ’s landmass overall is rising slowly with an average GIA of around 0.3 mm/year of relative sea level.
The diagram below shows the effect of land subsidence relative to sea-level rise. It is this relative sea-level rise that has to be adapted to locally or regionally. Conversely, uplift of the land mass reduces the coastal impact of rising ocean levels.

Future sea-level rise projections
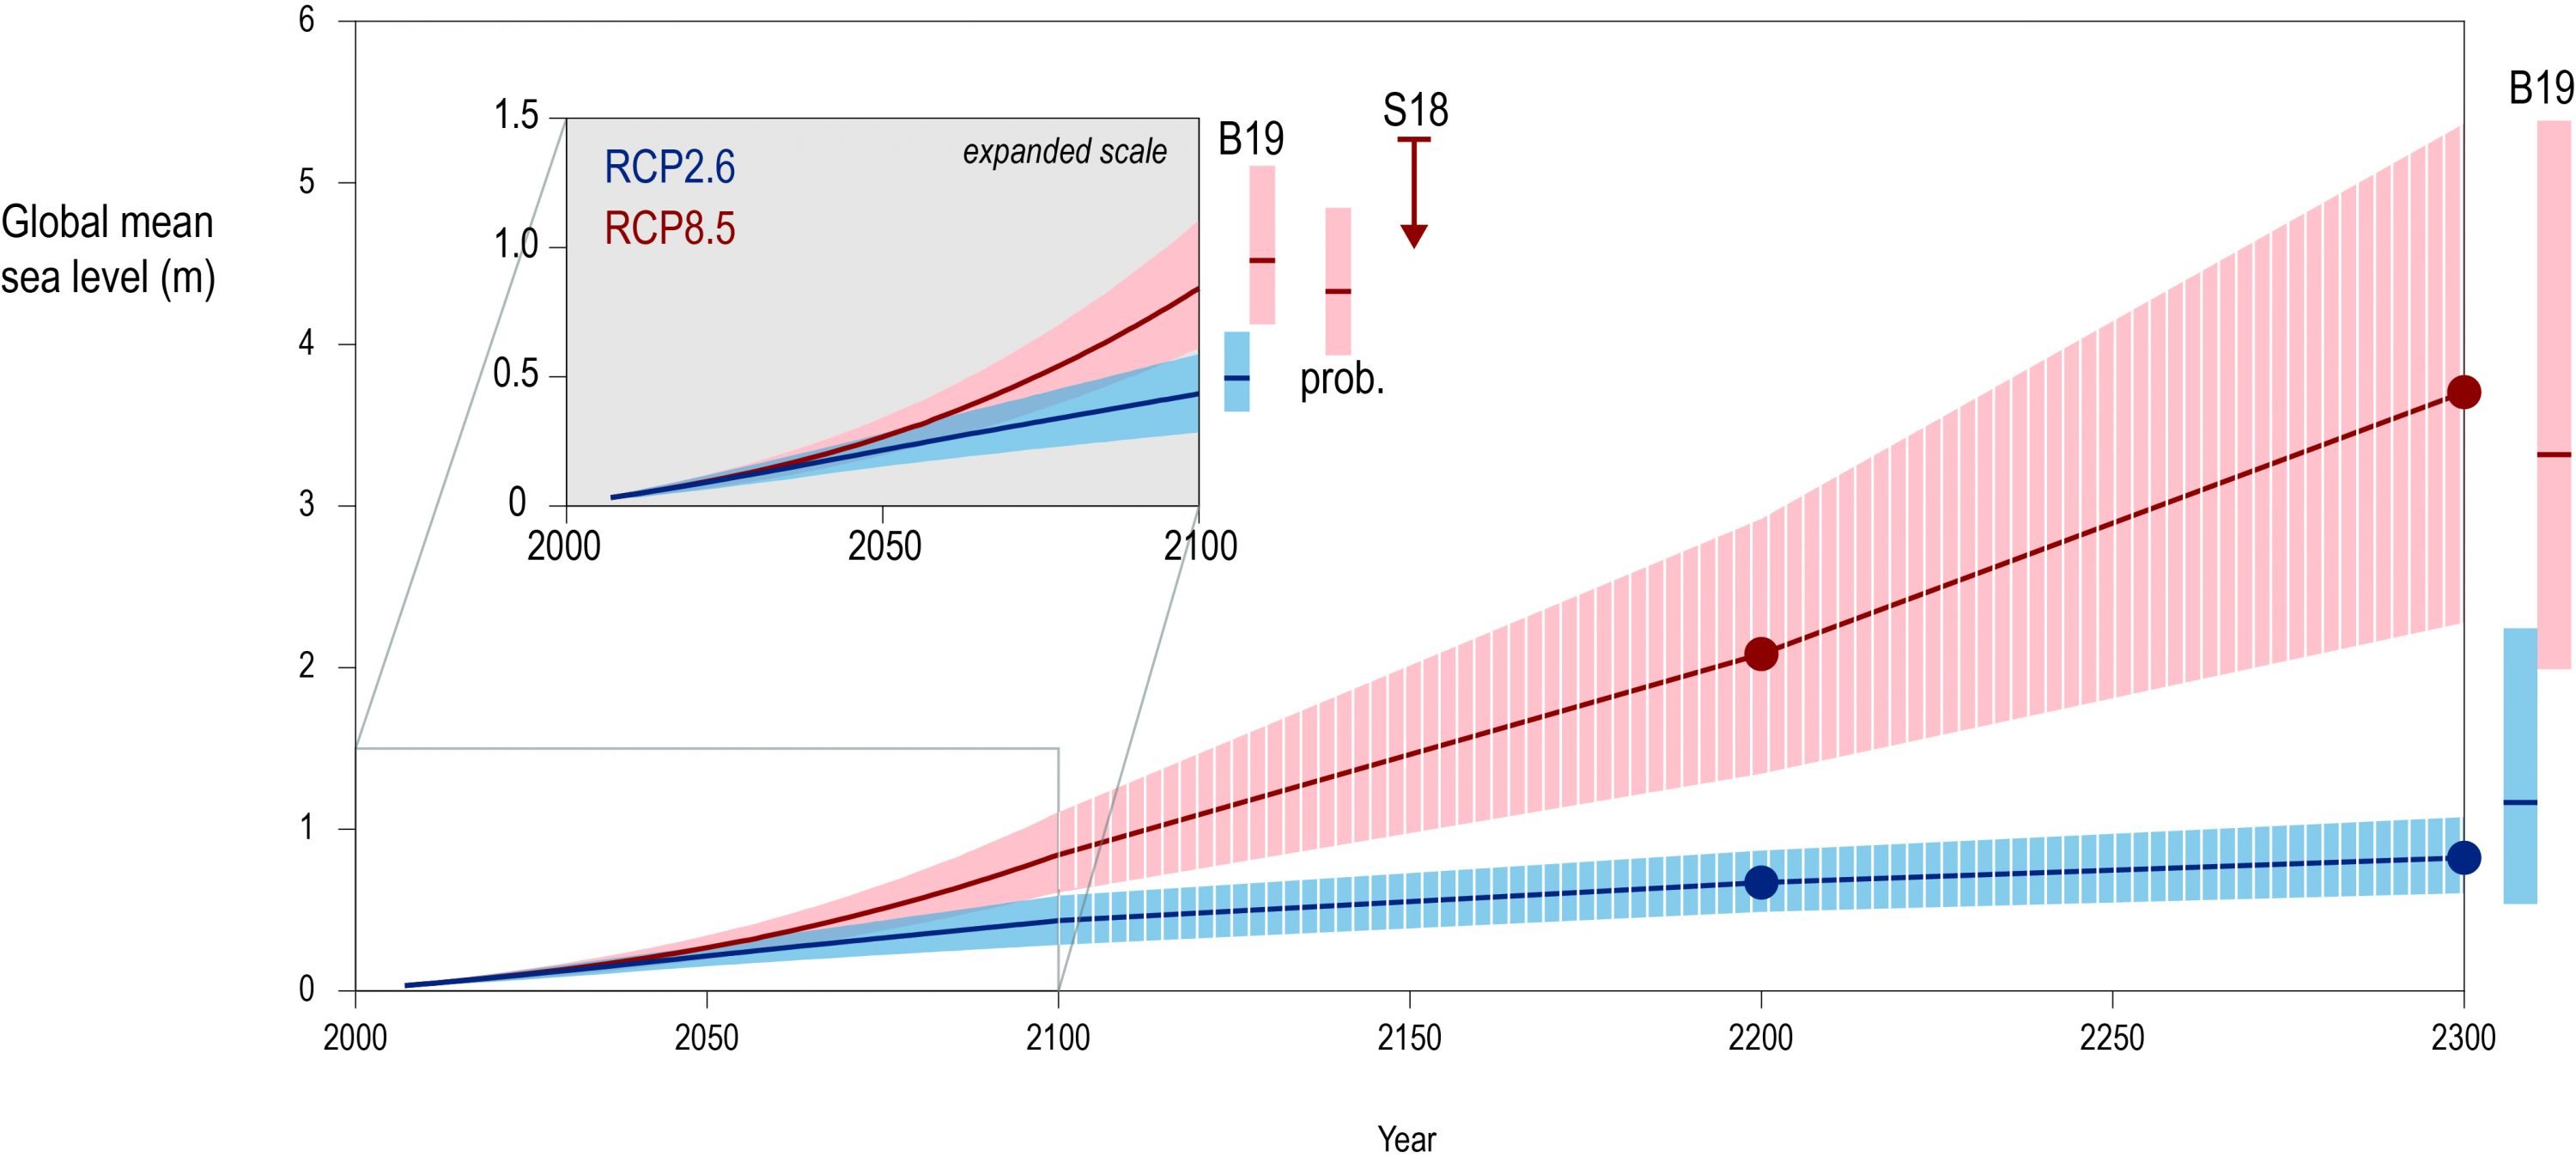
Global average projections
Heat is being trapped in the atmosphere by increasing concentrations of carbon dioxide (CO2) and other greenhouse gases, and the climate-ocean and ice systems are responding to this increased energy. Rising sea level is one of the last environmental changes we see in response to surface heating, due to the long lag for heating to penetrate the deep oceans and melt the vast polar ice sheets. However, in time sea-level rise will be one of the top climate risks we face globally. Up to 630 million people currently live on land that would be impacted by annual coastal flood levels in 2100 (Kulp and Strauss, 2019)
The Intergovernmental Panel on Climate Change (IPCC) released its Fifth Assessment Report (AR5) in 2013/14, with Chapter 13 of the Working Group I report providing a detailed synthesis of past, present and future change in mean sea level.
Due to the non-linear and delayed responses of ocean and ice environments to ongoing climate change, natural variability and uncertainty on rate of global emissions, it is not appropriate to extrapolate historic or even recent trends in sea-level rise observations.
Instead, future projections of sea-level rise for a range of future climate scenarios are relied on for testing the robustness of our future planning for communities and infrastructure. These projections use coupled climate-ocean and ice-sheet models to quantify changes to climate-ocean-ice systems. Sea-level projections can also include informed estimates surveying a wide group of climate experts for uncertain components, for example, polar ice-sheet response.
IPCC and researchers world-wide base their projections for sea-level rise on four Representative Pathway Concentrations (RCPs). These 4 scenarios are representative of four different groupings of future radiative forcing (warming) by greenhouse gas emissions and associated social, economic, population and land-use projections. See Appendix C of Coastal Hazards and Climate Change Guidance for further details.
IPCC AR5 bases projections of global temperature rise and sea-level rise on simulations of various global climate–ocean modelling groups using these four RCPs ranging from a low-emissions scenario (similar to the aspirational 2015 Paris Agreement target) through to a scenario of continuing high emissions with no effective mitigation policies. Further information on how projections for sea-level rise are determined can be found in Appendix D of Coastal Hazards and Climate Change Guidance.
IPCC special report (2019): The ocean and cryosphere in a changing climate
In September 2019, the IPCC released its Special Report on the ocean and cryosphere (ice environments) in a changing climate, providing further updates and projections to the IPCC AR5 report in 2013/14. This special report was written by 104 scientists from 36 countries who assessed over 30,000 comments from expert reviewers and governments in 80 countries. The report assesses the latest scientific knowledge about the physical science basis and impacts of climate change on ocean, coastal, polar and mountain ecosystems, and the human communities that depend on them. It evaluates vulnerabilities and adaptation capacities and presents options for achieving climate-resilient development pathways. Read the report here.
Projections relevant for New Zealand
Research has shown that sea level in the wider sea around Aotearoa-New Zealand will rise by 5-10% more than the global average rise that IPCC provides (e.g. Ackerley et al., 2013, Kopp et al., 2014). Regions and local areas within New Zealand will also be affected differently by vertical land movement and local changes in tides (e.g. estuaries and tidal streams), which need to be factored in, as it is the local sea-level rise relative to the landmass that has to be adapted to – not just the rise in ocean levels.
Four sea-level rise scenarios out to 2150 for the wider seas around New Zealand are provided in Chapter 5 of the Coastal Hazards and Climate Change Guidance, specifically Tables 10-11 and Figure 27. They are purposefully constructed to meet the requirements in the NZ Coastal Policy Statement to plan ahead for “at least 100 years” and for use in developing and stress-testing options in dynamic adaptive pathways to plan ahead for adaptation in coastal lowland areas.
These four sea-level rise scenarios from the national coastal guidance are combined below with the measured annual mean sea level series from 5 long-term sites from 2000 to 2019 to illustrate how sea level is presently tracking. Given it may be a few decades before it becomes clear how sea-level rise is tracking, it is important not to delay decisions waiting for more certainty but rather to adopt an adaptive approach as provided in the national coastal guidance.

Figure: Four scenarios of New Zealand-wide sea-level rise projections recommended in the Ministry for the Environment’s 2017 coastal guidance, based on the IPCC 5th Assessment Report, with the extensions to 2150 and the highest scenario, based on Kopp et al. (2014). Measurements up to 2019 are from: Auckland, Moturiki, Wellington, Lyttelton, Dunedin. Sea level height is relative to the average mean sea level over the recent period 1986-2005, which IPCC use as a zero baseline for projections.
NZ SeaRise project and maps
The NZ SeaRise Te Tai Pari O Aotearoa project is a $7.1 million Endeavour research programme funded by the Ministry of Business, Innovation and Employment that runs for five years (from 2018 to 2023). The goal of the programme is to improve projections of sea-level rise in Aotearoa New Zealand to 2100 and beyond, both nationally and at the local scale (including vertical land movement).
NIWA and GNS Science are partners in NZ SeaRise, which is hosted at Victoria University of Wellington. Read about the project here.
NZ SeaRise maps
In May 2022, the NZ SeaRise programme released location specific sea-level rise projections out to the year 2300 for every 2 km of the coast of Aotearoa, New Zealand. These projections can be accessed through a new online tool. For the first time, New Zealanders can see how much and how fast the sea level will rise along ‘their own’ stretch of coast and in their neighbourhood.
Climate change and warming temperatures are causing sea level to rise, on average, by 3.5 mm per year. This sea-level rise is caused by thermal expansion of the ocean, by melting land-based glaciers, and by melting of the Greenland and Antarctic ice sheets. However, local sea-level rise around the coast of Aotearoa is also affected by the up and down movements of our land. We are very aware of when these vertical land movements occur in large jumps during earthquakes, but less obvious to us are the smaller shifts that occur continuously in between significant seismic events. These small but continuous changes add up, and in areas that are going down (subsiding), the annual rate of sea-level rise can double. We have connected this vertical land movement data with the climate-driven sea-level rise to provide locally relevant sea-level projections.
Experts from Te Herenga Waka: Victoria University of Wellington, GNS Science, NIWA, the University of Otago, and the Antarctic Science Platform worked together to provide these improved predictions of sea-level rise in Aotearoa, New Zealand.
Will the rise in sea level be a steady increase?
No, not in the foreseeable future, as annual average sea levels will continue to show year-to-year and decadal variability arising from natural climate cycles like El Niño–Southern Oscillation and the longer 20-30 year Inter-decadal Pacific Oscillation (IPO).
For instance, a change around 1999 in the phase of the IPO led to a step-jump in sea levels around New Zealand and the wider SW Pacific, followed by a few years of relatively stable mean sea levels, before rising again more recently (as shown in the below diagram showing the Moturiki Island sea-level series). Peaks also occur in annual sea level in New Zealand during La Niña events (e.g. 1989) and lower annual sea levels tend to occur in El Niño events (e.g. 1993). This pattern of faster and slower short-term fluctuation in sea level will continue to be superimposed on an underlying longer-term trend of rising sea level due to climate change.

Figure: Moturiki annual mean sea level up to 2018 - plotted to Moturiki Vertical Datum-1953 (MVD-53), which was set to zero based on measurements in 1949-52.
If sea-level rise is only 2–3 millimetres per year, then why worry?
Historically, the gradual rise in sea level has accumulated to be around 20 cm over the 20th century through to present. This can be enough, in combination with a severe storm-tide event, to cause seawater inundation of low-lying coastal margins, as occurred in parts of Auckland in 2011 and 2014. Further rises in sea level will further exacerbate such situations with more frequent coastal inundation and erosion of vulnerable coastal areas (Parliamentary Commissioner for the Environment 2015 report).
The oceans store the majority (90%) of excess heat within the Earth’s climate system, with considerable lag times in the ocean response. Consequently, sea-level rise is also a very consistent and reliable indicator of climate change, albeit one of the last indicators to respond, as the oceans integrate increasing heat input and additional water mass from ice sheets, glaciers and net water loss from the land. So, the slower historic rate in global sea-level rise (1.5 to 1.8 mm/year since 1900) or even recent rates of global sea-level rise (e.g. 3.54 mm/year from satellite observations since 1992) are not a reliable indicator of future sea-level change by the end of this century, and considerably underestimate the rate at which sea level could rise.


