Cam-Era for You
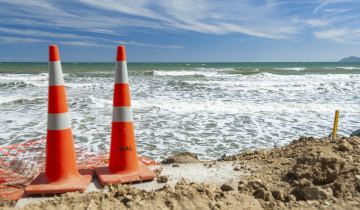
Water Levels: Our Cam-Era installation on the Ashburton River overlooks a hapua or coastal lagoon. We know the exact location of several posts in the front of the image, and we can use these and the position of the camera to back-calculate the water level.
What Cam-Era can do for you
Every day we come up with new things that Cam-Era can monitor. These are some of our current uses.
Just simply using the snapshots collected every hour...
- Counting objects, for example bird populations and how people make use of access ways
- Water levels can be measured in lakes or lagoons by sighting on graduated poles in the field of view; accuracy of the measurements depends on how close the camera is to the pole. (Extreme water levels can also be measured in this way.)
- River mouth migration
- Dune toe and high-water mark location for mapping coastal hazards
- Updates on surf and beach and river mouth conditions for recreational and commercial users
- Navigation state of flows in rivers and on bars
- Gravel transport in rivers
- Making movies for education and research
Using some of the fancier Cam-Era products, such as averages of groups of images...
People Counting: This is the average number of people that came to Tairua beach during January and February in 1997. We have plotted them by day, but you could also compare weekend and weekday use, or even record where the most people congregated on the beach. This information can be used to locate access ways and in designing other amenities.
- Shoreline position, high water mark
- Rip location and movements: these can be measured from the mean location of wave breaking.
- Sand banks and bar location and movement can be measured from the mean location of wave breaking.
- Longshore current direction: the direction of foam streak movement that can be identified from time-stacks gives the direction of the longshore current.
...and time-stacks
Shoreline Change and Rip Currents: The top panel shows how the averaged image on the previous page can be rectified to a plan view. The bottom panel shows the type of parameters that can be measured from the plan view.
For example, the locations of all the rip currents have been measured (the red arrows), and a computer algorithm has been used to find the location of the shoreline (yellow line).
- Wave run-up
- Wave statistics: we can measure wave period, direction and speed from the snap-shots and timestacks; these are good, accurate measurements with high spatial and temporal resolution. We are also investigating ways of measuring wave height.
- Nearshore bathymetry: the wave speed measured off the timestacks changes with the depth of the water.
You think of an application and we will find a way to do it!