
Seasonal Climate Outlook July - September 2009
A wet end to winter, with near average temperatures in most regions.
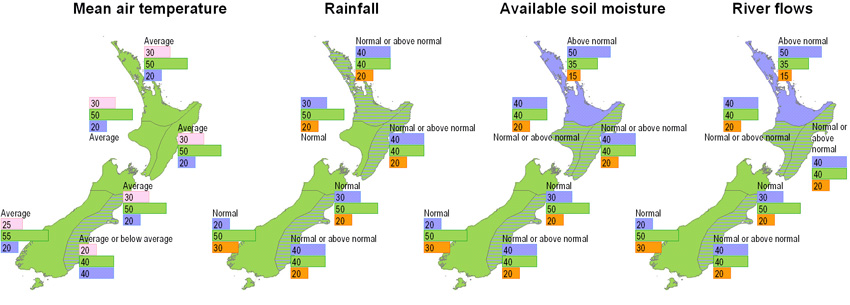
Rainfall is expected to be normal or above normal over the north and east of the North Island, and in Canterbury, over the next three month period, according to the latest outlook from NIWA’s National Climate Centre.
Rainfall is likely to be near normal in western districts of both Islands, and in Nelson and Marlborough.
After a very cold two months, the centre says temperatures for the coming season (July, August, and September combined) are likely to be about average, except for Canterbury and eastern Otago where average or below average temperatures are expected.
Cold spells and seasonal frosts are still expected throughout the South Island and central North Island.
The centre says that normal or above normal soil moisture levels and stream flows are likely in all regions.
For the July-September period as a whole, lower than normal pressures are likely to the north of New Zealand and higher than normal pressures to the southeast, with easterly flow anomalies over the country. This circulation pattern could break down in early spring, and change to a regime of more frequent south-westerlies over New Zealand if an El Niño becomes established in the equatorial Pacific.
In this example below, the climate models suggest that below normal conditions are likely (50% chance), but, given the variable nature of the climate, the chance of normal or above normal conditions is also shown (30% and 20% respectively).

Overall Picture
Temperature:
Temperatures are likely to be average in all regions, except for average or below average in the east of the South Island. Sea surface temperatures around New Zealand are likely to be near average or slightly below average through the July-September period.
Rainfall, soil moisture, and stream flows:
Rainfall is likely to be normal or above normal over the northern North Island and eastern regions of both islands, and normal elsewhere. Above normal soil moisture levels and stream flows are likely in the northern North Island. Normal or above normal soil moisture levels and stream flows are likely in the remainder of the North Island and the east of the South Island. Normal conditions are likely elsewhere in t he South Island.
Regional predictions for the next three months:
Northland, Auckland, Waikato, Bay of Plenty:
Average temperatures are likely. Normal or above normal rainfall, and above normal soil moisture and stream flows, are expected.
Probabilities are assigned in three categories; above average, average, and below average. The full probability breakdown is:
| Temperature | Rainfall | Soil moisture | Stream flows | |
|---|---|---|---|---|
| Above normal | 30 % | 40 % | 50 % | 50 % |
| Normal | 50 % | 40 % | 35 % | 35 % |
| Below normal | 20 % | 20 % | 15 % | 15 % |
North Island, Taranaki, Wan ganui, Manawatu and Wellington
Average temperatures are likely. Normal rainfall is likely, with soil moisture and stream flows expected to be normal or above normal.
Probabilities are assigned in three categories; above average, average, and below average. The full probability breakdown is:
| Temperature | Rainfall | Soil moisture | Stream flows | |
|---|---|---|---|---|
| Above normal | 30 % | 30 % | 40 % | 40 % |
| Normal | 50 % | 50 % | 40 % | 40 % |
| Below normal | 20% | 20 % | 20 % | 20 % |
Gisborne, Hawke’s Bay, Wairarapa:
Near average temperatures are likely for the three months. Rainfall is expected to be normal or above normal, as are soil moisture and stream flows.
Probabilities are assigned in three categories; above average, average, and below average. The full probability breakdown is:
| Temperature | Rainfall | Soil moisture | Stream flows | |
|---|---|---|---|---|
| Above normal | 30 % | 40 % | 40 % | 40 % |
| Normal | 50 % | 40 % | 40 % | 40 % |
| Below normal | 20 % | 20 % | 20 % | 20 % |
Nelson, Marlborough, Buller:
Average temperatures are likely, with near normal rainfall, soil moisture and stream flows.
Probabilities are assigned in three categories; above average, average, and below average. The full probability breakdown is:
| Temperature | Rainfall | Soil moisture | Stream flows | |
|---|---|---|---|---|
| Above normal | 30 % | 30 % | 30 % | 30 % |
| Normal | 50 % | 50 % | 50 % | 50 % |
| Below normal | 20 % | 20 % | 20 % | 20 % |
West Coast, Alps and Foothills, Inland Otago, Southland:
Average temperatures are likely. Rainfall is expected to be normal, as are soil moisture and stream flows.
Probabilities are assigned in three categories; above average, average, and below average.The full probability breakdown is:
| Temperature | Rainfall | Soil moisture | Stream flows | |
|---|---|---|---|---|
| Above normal | 25 % | 20 % | 20 % | 20 % |
| Normal | 55 % | 50 % | 50 % | 50 % |
| Below normal | 20 % | 30 % | 30 % | 30 % |
Coastal Canterbury, East Otago:
Average or below average temperatures are likely. Rainfall is expected to be normal or above normal for the three month period as a whole. Soil moisture and stream flows are also expected to be normal or above normal.
Probabilities are assigned in three categories; above average, average, and below average. The full probability breakdown is:
| Temperature | Rainfall | Soil moisture | Stream flows | |
|---|---|---|---|---|
| Above normal | 20 % | 40 % | 40 % | 40 % |
| Normal | 40 % | 40 % | 40 % | 40 % |
| Below normal | 40 % | 20 % | 20 % | 20 % |
Ocean temperatures in the equatorial Pacific have risen rapidly in the last few months, and the easterly trade winds have weakened. There is now a very high likelih ood of a transition to El Niño during the next few months. About half of the climate models NIWA monitors have an El Niño in place by the end of winter, whereas others delay the development until spring or summer.
However, the type of circulation pattern often seen in the New Zealand region during El Niños in late winter – persistent southerly and south-westerly airflow – is not expected to be the dominant pattern over the coming three months. >Instead, the forecast models suggest we could see continued lower than normal pressures to the north of New Zealand and higher than normal pressures to the southeast, with more frequenty easterly flow anomalies over the country. This pattern is known as a low index or blocking regime, and usually results in normal or above normal rainfall in the north of the country and in eastern districts.
As the mid-latitude circulation begins to respond later in the year to El Niño conditions in the tropical Pacific, we would expect to see a circulation shift to more frequent south-westerlies in the spring. Depending on the intensity of the El Niño, this would suggest a heightened risk of drought in northern and eastern regions over late spring and summer, after a good start to spring with soil moisture levels near or above normal at the end of winter.
For comment, please contact:
Dr Brett Mullan, NIWA Principal Scientist, Climate Variability & Change
Tel (04) 3860508 (office DDI)
Ms Georgina Griffiths, NIWA Climate Scientist
Tel (09) 375 4506 (office DDI), 0272 936545 (cell)
© Copyright NIWA 2009. All rights reserved. Acknowledgement of NIWA as the source is required.
Notes to reporters & editors
- NIWA’s outlooks indicate the likelihood of climate conditions being at, above, or below average for the season as a whole. They are not ‘weather forecasts’. It is not possible to forecast precise weather conditions three months ahead of time.
- The outlooks are the result of the expert judgment of NIWA’s climate scientists. They take into account observations of atmospheric and ocean conditions and output from global and local climate models. The presence of El Niño or La Niña conditions and the sea surface temperatures around New Zealand can be a useful indicator of likely overall climate conditions for a season.
- The outlooks state the probability for above average conditions, average conditions, and below average conditions for rainfall, temperature, soil moisture, and stream flows. For example, for winter (June-July-August) 2007, for all the North Island, we assigned the following probabilities for temperature:
- Above average: 60%
- Average: 30%
- Below average: 10%
- This three-way probability means that a random choice would only be correct 33% (or one-third) of the time. It would be like randomly throwing a dart at a board divided into 3 equal parts, or throwing a dice with three numbers on it. An analogy with coin tossing (a two-way probability) is not correct.
- A 50% ‘hit rate’ is substantially better than guess-work, and comparable with the skill level of the best overseas climate outlooks. See, for example, analysis of global outlooks issued by the International Research Institute for Climate and Society based in the U.S. (http://iri.ldeo.columbia.edu/) published in the Bulletin of the American Meteorological Society (Goddard, L., A. G. Barnston, and S. J. Mason, 2003: Evaluation of the IRI's “net assessment” seasonal climate forecasts 1997-2001. Bull. Amer. Meteor. Soc., 84, 1761-1781).
- Each month NIWA publishes an analysis of how well its outlooks perform. This is available on-line and is sent to about 3,500 recipients of NIWA’s newsletters, including many farmers. See The Climate Update
- All outlooks are for the three months as a whole. There will inevitably be wet and dry days, hot and cold days, within a season.
- The seasonal climate outlooks are an output of a scientific research programme, supplemented by NIWA’s Capability Funding. NIWA does not have a government contract to produce these outlooks.