
Seasonal Climate Outlook: February - April 2010
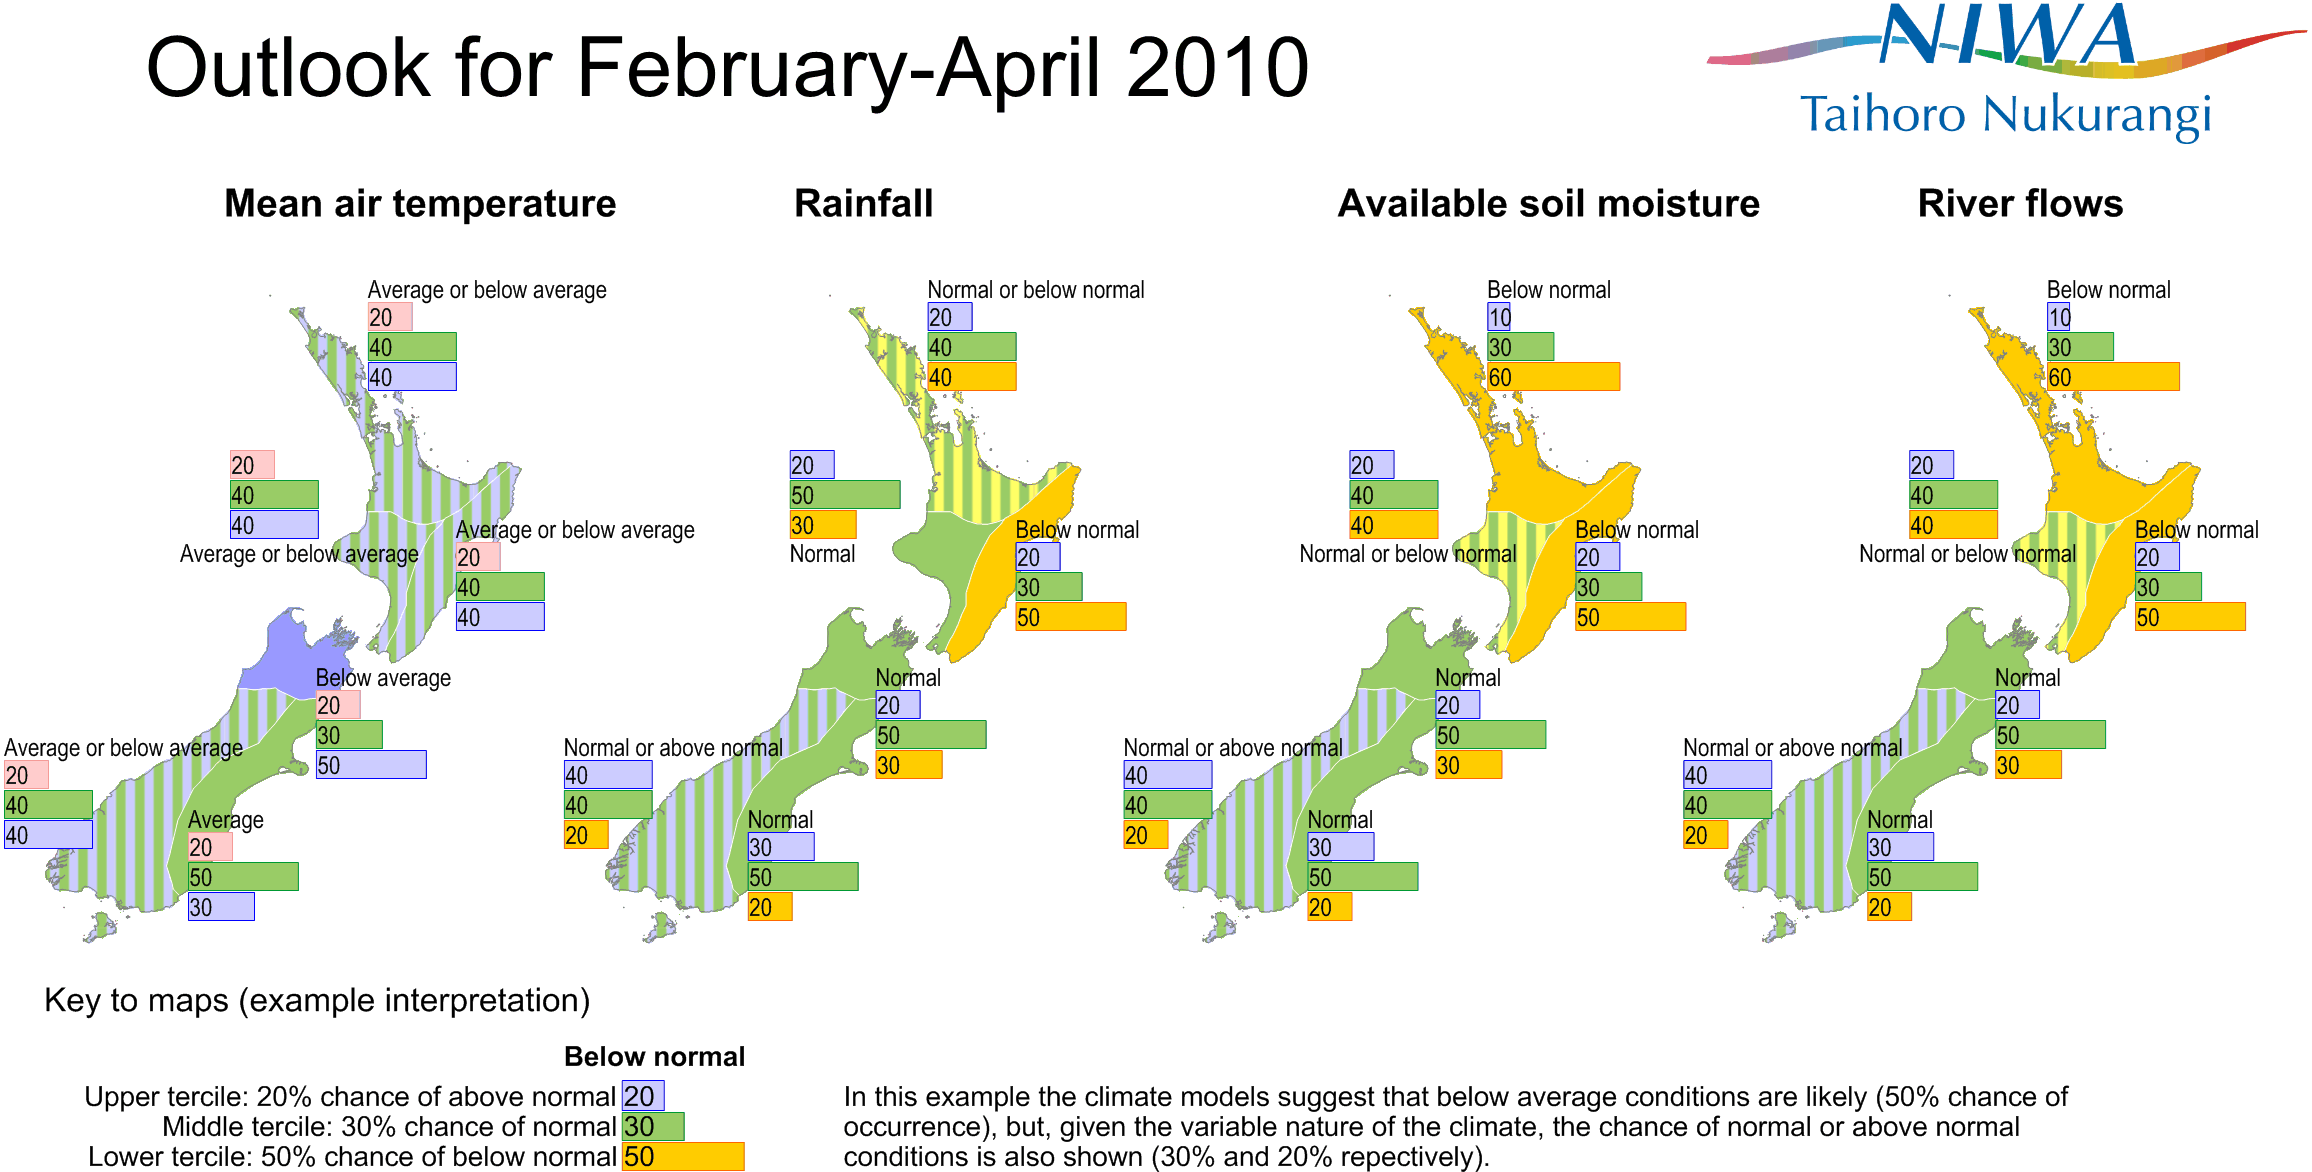
A cool end to summer, and continuing drier than normal in the north.
The current El Niño continues at moderate strength in the equatorial Pacific, but is likely to weaken during the autumn. The NIWA National Climate Centre says that means temperatures are likely to continue to be on the cool side, and dry conditions are also likely to continue in the north of the North Island.
The centre’s latest outlook states that on average over the three months February-April, mean sea level pressures are likely to be higher than normal to the north of the country, associated with slightly stronger than normal westerlies over New Zealand.
Current drier than normal soil conditions are likely to continue in the north of the North Island, and are likely to prevail in the east of the North Island, where below normal stream flows and soil moisture levels are likely through to April.
The centre says February to April rainfall totals are likely to be in the normal or below normal range in the north and east of the North Island and in Marlborough, normal or above normal in the western South Island, and in the normal range in other regions.
Temperatures are likely to be near average or below average in all regions, over the three months of February to April as a whole. There will still be variability, with some warm spells at times, especially in eastern regions in north-westerly wind conditions.
River flows and soil moistures are likely to be near normal or below normal in the North Island, near normal in the north and east of the South Island, and normal or above normal in the western South Island.
Overall Picture
Temperature:
Air temperatures are likely to be average or below average everywhere. Sea surface temperatures are expected to remain below average around and east of the South Island, and near average to the north of New Zealand.
Rainfall, soil moisture, and stream flows:
Rainfall is likely to be normal or below normal over the north and east of the North Island and in Marlborough, normal or above normal in the west and south of the South Island, and near normal elsewhere. Rivers flows and soil moistures are likely to be near normal or below normal in the North Island, near normal in the north and east of the South Island, and normal or above normal in the west and south of the South Island.
Regional predictions for the next three months:
Northland, Auckland, Waikato, Bay of Plenty:
Temperatures are equally likely to be in the near average or below average category. Seasonal rainfall totals are equally likely to be near normal or below normal, while river flows and soil moisture levels are very likely to be in the below normal range.
Probabilities are assigned in three categories; above average, near average, and below average. The full probability breakdown is:
| Temperature | Rainfall | Soil moisture | Stream flows | |
|---|---|---|---|---|
| Above average | 20% | 20% | 10% | 10% |
| Near average | 40% | 40% | 30% | 30% |
| Below average | 40% | 40% | 60% | 60% |
Central North Island, Taranaki, Wanganui, Manawatu and Wellington
Seasonal temperatures are likely to be in the average or below average category. Rainfall totals are likely to be near normal, while stream flows and soil moisture levels are likely to be near normal or below normal, for the three months as a whole.
Probabilities are assigned in three categories; above average, near average, and below average. The full probability breakdown is:
| Temperature | Rainfall | Soil moisture | Stream flows | |
|---|---|---|---|---|
| Above average | 20% | 20% | 20% | 20% |
| Near average | 40% | 50% | 40% | 40% |
| Below average | 40% | 30% | 40% | 40% |
Gisborne, Hawke’s Bay, Wairarapa:
Temperatures averaged over the three months are equally likely to be in the near average or below average category. Seasonal rainfall totals, stream flows and soil moisture levels are likely to be below normal.
Probabilities are assigned in three categories; above normal, near normal, and below normal.The full probability breakdown is:
| Temperature | Rainfall | Soil moisture | Stream flows | |
|---|---|---|---|---|
| Above average | 20% | 20% | 20% | 20% |
| Near average | 40% | 30% | 30% | 30% |
| Below average | 40% | 50% | 50% | 50% |
Nelson, Marlborough, Buller:
Seasonal temperatures are likely to be below average. Rainfalls, stream flows and soil moisture levels are likely to be normal over all, but with below normal rainfalls more likely in the east of the region.
Probabilities are assigned in three categories; above average, near average, and below average. The full probability breakdown is:
| Temperature | Rainfall | Soil moisture | Stream flows | |
|---|---|---|---|---|
| Above average | 20% | 20% | 20% | 20% |
| Near average | 30% | 50% | 50% | 30% |
| Below average | 50% | 30% | 30% | 50% |
West Coast, Alps and Foothills, Inland Otago, Southland:
Temperatures are likely to be in the average or below average category. Seasonal rainfall, stream flows and soil moisture levels are equally likely to be near normal or above normal.
Probabilities are assigned in three categories; above average, near average, and below average. The full probability breakdown is:
| Temperature | Rainfall | Soil moisture | Stream flows | |
|---|---|---|---|---|
| Above average | 20% | 40% | 40% | 40% |
| Near average | 40% | 40% | 40% | 40% |
| Below average | 40% | 20% | 20% | 20% |
Coastal Canterbury, East Otago:
Temperatures are most likely to be in the near average category, averaged over February-April. Seasonal rainfall totals, soil moisture levels and stream flows are all likely to be in the normal range.
Probabilities are assigned in three categories; above average, near average, and below average. The full probability breakdown is:
| Temperature | Rainfall | Soil moisture | Stream flows | |
|---|---|---|---|---|
| Above average | 20% | 30% | 30% | 20% |
| Near average | 50% | 50% | 50% | 50% |
| Below average | 30% | 20% | 20% | 20% |
Background
The El Niño continues at moderate strength in the Tropical Pacific, and exhibits many features of a mature event. As often occurs, the El Niño is expected to weaken towards neutral conditions through the autumn.
El Niño events can often lead to dry conditions in eastern and northern parts of New Zealand over the summer season. Soil moistures are very low in Northland, and in some parts of the Bay of Plenty, and eastern south Canterbury and Otago. The latest outlook suggests that drier conditions are likely in the north and east of the North Island on average through to April. El Niño events are also often associated with cooler than average conditions in the New Zealand region, consistent with the latest outlook.
For comment, please contact:
Dr James Renwick, NIWA Principal Scientist, Climate Variability & Change
Tel mobile (021) 178 5550, office DDI (04) 386 0343
Dr Brett Mullan, NIWA Principal Scientist, Climate Variability & Change
Tel (04) 386 0508 (office DDI)
© Copyright NIWA 2010. All rights reserved. Acknowledgement of NIWA as the source is required.
Notes to reporters & editors
- NIWA’s outlooks indicate the likelihood of climate conditions being at, above, or below average for the season as a whole. They are not ‘weather forecasts’. It is not possible to forecast precise weather conditions three months ahead of time.
- The outlooks are the result of the expert judgment of NIWA’s climate scientists. They take into account observations of atmospheric and ocean conditions and output from global and local climate models. The presence of El Niño or La Niña conditions and the sea surface temperatures around New Zealand can be a useful indicator of likely overall climate conditions for a season.
- The outlooks state the probability for above average conditions, average conditions, and below average conditions for rainfall, temperature, soil moisture, and stream flows. For example, for winter (June-July-August) 2007, for all the North Island, we assigned the following probabilities for temperature:
- Above average: 60%
- Average: 30%
- Below average: 10%
- This three-way probability means that a random choice would only be correct 33% (or one-third) of the time. It would be like randomly throwing a dart at a board divided into 3 equal parts, or throwing a dice with three numbers on it. An analogy with coin tossing (a two-way probability) is not correct.
- A 50% ‘hit rate’ is substantially better than guess-work, and comparable with the skill level of the best overseas climate outlooks. See, for example, analysis of global outlooks issued by the International Research Institute for Climate and Society based in the U.S. (http://iri.ldeo.columbia.edu/) published in the Bulletin of the American Meteorological Society (Goddard, L., A. G. Barnston, and S. J. Mason, 2003: Evaluation of the IRI's “net assessment” seasonal climate forecasts 1997-2001. Bull. Amer. Meteor. Soc., 84, 1761-1781).
- Each month NIWA publishes an analysis of how well its outlooks perform. This is available on-line and is sent to about 3,500 recipients of NIWA’s newsletters, including many farmers. See The Climate Update
- All outlooks are for the three months as a whole. There will inevitably be wet and dry days, hot and cold days, within a season.
- The seasonal climate outlooks are an output of a scientific research programme, supplemented by NIWA’s Capability Funding. NIWA does not have a government contract to produce these outlooks.