
Seasonal Climate Outlook: April - June 2010
A warm end to autumn.
The NIWA National Climate Centre says that mean temperatures are very likely to be above the long-term average in most parts of the country, over the three months April–June. However, short-term cold snaps will still occur, especially as we move into winter. Despite recent dryness, near normal seasonal rainfalls are likely in most places.
The centre’s latest outlook, for late autumn 2010, states that mean sea level pressures are likely to be slightly lower than normal over the country, associated with slightly stronger than normal westerlies over New Zealand, on average for April-June. The current El Niño in the equatorial Pacific is likely to weaken to neutral conditions by the winter.
Below normal soil moisture levels and stream flows are likely for the April–June period in the north and east of the North Island, and very likely in the east of the South Island. Near normal or below normal soil moisture levels and streamflows are likely in most other regions.
Overall Picture
Temperature:
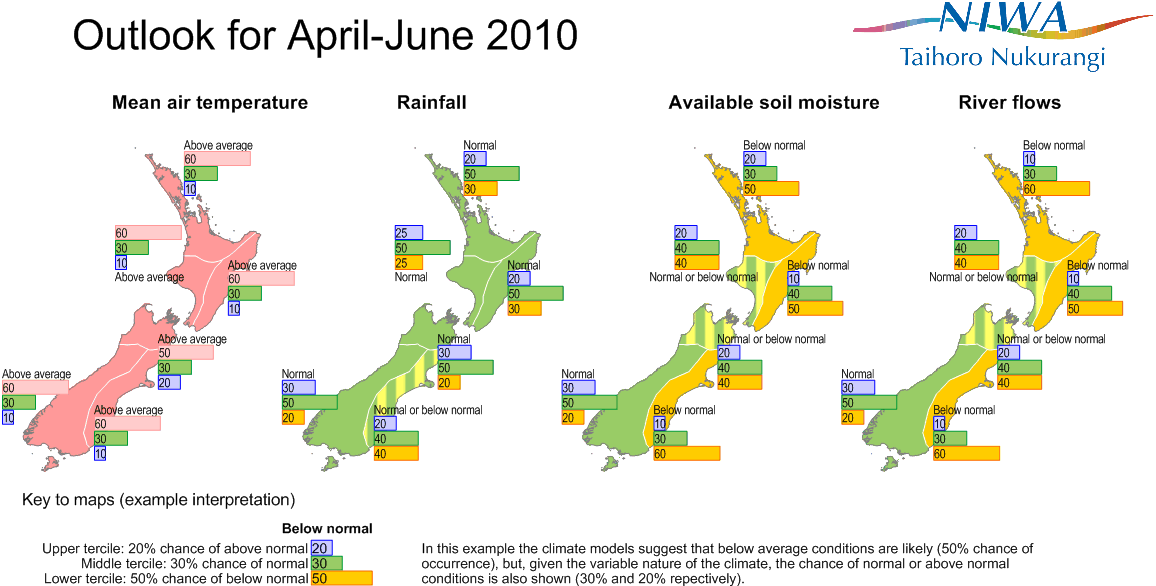
Above average temperatures are very likely across the country, over the three months of April to June as a whole. Sea surface temperatures are likely to be above average around the coasts.
Rainfall, soil moisture, and stream flows:
Rainfall is likely to be near normal in most regions, but near normal or below normal in the eastern South Island. Below normal soil moisture levels and stream flows are likely for the April–June period in the north and east of the North Island, and very likely in the east of the South Island. Near normal soil moisture levels and streamflows are likely for the south and west of the South Island. Elsewhere, soil moisture levels and streamflows are equally likely to be in the near normal or below normal range.
Regional predictions for the next three months:
Northland, Auckland, Waikato, Bay of Plenty:
Temperatures are very likely to be above average. Seasonal rainfall totals are likely to be near normal, while below normal soil moisture levels are likely. Stream flows are very likely to be in the below normal range.
Probabilities are assigned in three categories; above average, near average, and below average. The full probability breakdown is:
| Temperature | Rainfall | Soil moisture | Stream flows | |
|---|---|---|---|---|
| Above average | 60% | 20% | 20% | 10% |
| Near average | 30% | 50% | 30% | 30% |
| Below average | 10% | 30% | 50% | 60% |
Central North Island, Taranaki, Wanganui, Manawatu and Wellington:
Above average seasonal temperatures are very likely. Rainfall totals are likely to be near normal, while stream flows and soil moisture levels are equally likely to be in the near normal or below normal range, for the three months as a whole.
Probabilities are assigned in three categories; above average, near average, and below average. The full probability breakdown is:
| Temperature | Rainfall | Soil moisture | Stream flows | |
|---|---|---|---|---|
| Above average | 60% | 25% | 20% | 20% |
| Near average | 30% | 50% | 40% | 40% |
| Below average | 10% | 25% | 40% | 40% |
Gisborne, Hawke’s Bay, Wairarapa:
Temperatures averaged over the three months are very likely to be in the above average category. Seasonal rainfall totals are likely to be near normal, but stream flows and soil moisture levels are likely to be in the below normal range.
Probabilities are assigned in three categories; above normal, near normal, and below normal.The full probability breakdown is:
| Temperature | Rainfall | Soil moisture | Stream flows | |
|---|---|---|---|---|
| Above average | 60% | 20% | 10% | 10% |
| Near average | 30% | 50% | 40% | 40% |
| Below average | 10% | 30% | 50% | 50% |
Nelson, Marlborough, Buller:
Seasonal temperatures are likely to be in the above average range. Rainfalls are likely to be near normal overall, while stream flows and soil moisture levels are equally likely to be near normal or below normal.
Probabilities are assigned in three categories; above average, near average, and below average. The full probability breakdown is:
| Temperature | Rainfall | Soil moisture | Stream flows | |
|---|---|---|---|---|
| Near average | 30% | 50% | 40% | 40% |
| Below average | 20% | 20% | 40% | 40% |
West Coast, Alps and Foothills, Inland Otago, Southland:
Temperatures are very likely to be in the above average category. Seasonal rainfall, stream flows and soil moisture levels are likely to be near normal.
Probabilities are assigned in three categories; above average, near average, and below average. The full probability breakdown is:
| Temperature | Rainfall | Soil moisture | Stream flows | |
|---|---|---|---|---|
| Above average | 60% | 30% | 30% | 30% |
| Near average | 30% | 50% | 50% | 50% |
| Below average | 10% | 20% | 20% | 20% |
Coastal Canterbury, East Otago:
Temperatures are very likely to be in the above average category, on the whole during April–June. Seasonal rainfall totals are equally likely to be in the normal or the below normal range, while soil moisture levels and stream flows are very likely to be below normal.
Probabilities are assigned in three categories; above average, near average, and below average. The full probability breakdown is:
| Temperature | Rainfall | Soil moisture | Stream flows | |
|---|---|---|---|---|
| Above average | 60% | 20% | 10% | 10% |
| Near average | 30% | 40% | 30% | 30% |
| Below average | 10% | 40% | 60% | 60% |
Background
An El Niño continues in the Tropical Pacific, but is showing signs of weakening, and neutral conditions are likely by the winter.
For comment, please contact:
Georgina Griffiths, NIWA Climate Scientist
Tel (09) 375 4506 (office DDI), mobile (027) 293 6545
Dr James Renwick, NIWA Principal Scientist, Climate Variability & Change
Tel (04) 386 0343 (office DDI), mobile (021) 178 5550
© Copyright NIWA 2010. All rights reserved. Acknowledgement of NIWA as the source is required.
Notes to reporters & editors
- NIWA’s outlooks indicate the likelihood of climate conditions being at, above, or below average for the season as a whole. They are not ‘weather forecasts’. It is not possible to forecast precise weather conditions three months ahead of time.
- The outlooks are the result of the expert judgment of NIWA’s climate scientists. They take into account observations of atmospheric and ocean conditions and output from global and local climate models. The presence of El Niño or La Niña conditions and the sea surface temperatures around New Zealand can be a useful indicator of likely overall climate conditions for a season.
- The outlooks state the probability for above average conditions, average conditions, and below average conditions for rainfall, temperature, soil moisture, and stream flows. For example, for winter (June-July-August) 2007, for all the North Island, we assigned the following probabilities for temperature:
- Above average: 60%
- Average: 30%
- Below average: 10%
- This three-way probability means that a random choice would only be correct 33% (or one-third) of the time. It would be like randomly throwing a dart at a board divided into 3 equal parts, or throwing a dice with three numbers on it. An analogy with coin tossing (a two-way probability) is not correct.
- A 50% ‘hit rate’ is substantially better than guess-work, and comparable with the skill level of the best overseas climate outlooks. See, for example, analysis of global outlooks issued by the International Research Institute for Climate and Society based in the U.S. (http://iri.ldeo.columbia.edu/) published in the Bulletin of the American Meteorological Society (Goddard, L., A. G. Barnston, and S. J. Mason, 2003: Evaluation of the IRI's “net assessment” seasonal climate forecasts 1997-2001. Bull. Amer. Meteor. Soc., 84, 1761-1781).
- Each month NIWA publishes an analysis of how well its outlooks perform. This is available on-line and is sent to about 3,500 recipients of NIWA’s newsletters, including many farmers. See The Climate Update
- All outlooks are for the three months as a whole. There will inevitably be wet and dry days, hot and cold days, within a season.
- The seasonal climate outlooks are an output of a scientific research programme, supplemented by NIWA’s Capability Funding. NIWA does not have a government contract to produce these outlooks.