
Feature article
Climate Explorer
Wind roses and forecasts of mean wind speed
Wind roses
If you want to find out the background wind conditions at a climate station near you, Climate Explorer can provide these data from over 60 sites around New Zealand. Choose the 'Climate Station' selection level on the Climate Explorer web page and follow the instructions to zoom to the nearest climate station on the map.
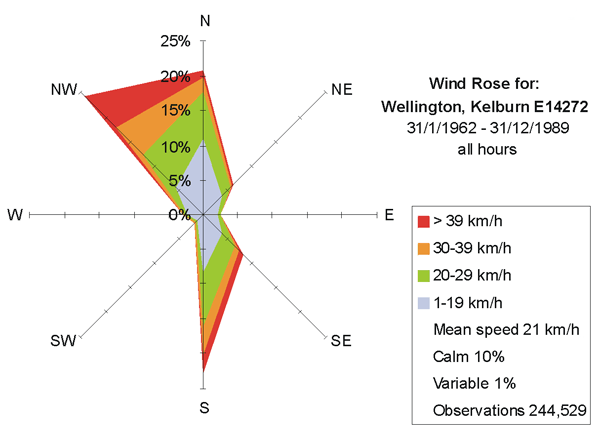
Historical wind patterns are represented in wind rose diagrams, like the example below from Kelburn, Wellington.
The wind rose diagram shows the percentage frequency of occurrence of winds of various strengths for the eight compass points, in a 'footprint' pattern. The extent of the footprint along each axis gives the overall frequency from that particular direction. The width of each colour band along the axes gives the frequency of winds within the strength range represented by those colours.
In the above example for Kelburn, a little over 21% of wind samples show wind from the north. This is made up of 11% of speeds ranging from 1-19 km/h (light blue band), about 6.5% in the 20-29 km/h (green) range, about 2% of 30-39 km/h, and about 2% exceeding 39 km/h.
The total compliment of wind occurrences (100%) is made up (approximately) of N, 21; NE, 6.5; E, 2.5; SE, 7.5; S, 23; SW, 2; W, 2.5; NW, 24, calm conditions, 10; and finally variable conditions, 1.
Note that the north, east, south, and west directions cover 50 degree sectors (e.g., east: 070° to 110°), while northeast, southeast, southwest, and northwest directions cover 40 degrees (e.g., southwest: 210° to 240°).
Wind forecasts

Climate Explorer provides wind speed forecasts out to two weeks, as shown in the example below. This forecast for Palmerston North was issued on 7 May, and shows expected average daily wind speeds out to 21 May. The horizontal red line shows the historical average daily wind speed for May.
The forecast suggests that wind speeds during the period are not likely to be particularly strong. The highest wind speeds are predicted to reach about 3.5 m/s, or 12.6 km/h, within the light blue range in a wind rose diagram.
For more information, and to obtain an annual subscription for unlimited access to all regularly updated products, please contact [email protected].
Annual subscriptions: Individual $185+gst, Corporate $370+gst.