Update on Pacific Islands rainfall outlook
S Burgess, NIWA


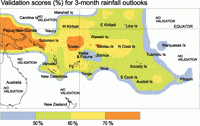
There have now been more than 60 seasonal rainfall outlooks issued for the Southwest Pacific through the ICU. Validation of these enables us to accurately assess how the forecasts have been progressing over the past five years. Figure 1 indicates how often the forecasts have been correct, in a categorical sense. The forecast category (below average, average or below, average, average or above, or above average) is taken to be that assigned the highest probability. The shaded areas on the map show the percentage frequency of correct forecasts (or the "hit" rate). The overall hit rate is equivalent to the percentage frequency of correct forecasts. This method provides a good indication of our skill over the period, whilst being reasonably simple to interpret.
Since our earlier analyses (see ICU issues Nos. 11 and 33), the hit rate has been above 50% over much of our Southwest Pacific forecast area. The highest skill (>70%) has occurred between latitudes 5 – 10 °S and west of about 165 °W. This region includes Papua New Guinea, the Solomon Islands, Tuvalu, and Tokelau. In contrast, scores have been much lower in Northern French Polynesia, and also the Wallis and Futuna – Western Samoa region. The area near Wallis and Futuna and Western Samoa is constantly in the transition zone for SPCZ-related rainfall, making it a more difficult region for seasonal rainfall prediction.
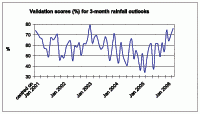
Over the entire time period (see Figure 2), the average hit rate for the total forecast region has ranged between about 35 and 80% throughout the period, with an overall mean of about 60%. If the forecasts were random, they would be correct about half the time on average. Overall, analysis of the statistics from over 60 rainfall outlooks overall shows that hit rates have exceeded 50% in most of (73%) forecasts, indicating about 10% more skill than "chance" of climatology. Inspection of the time series with the Southern Oscillation Index shows that the highest hit rates were achieved in the two La Niña periods. Skill during the weak El Niño and neutral episodes varied.
