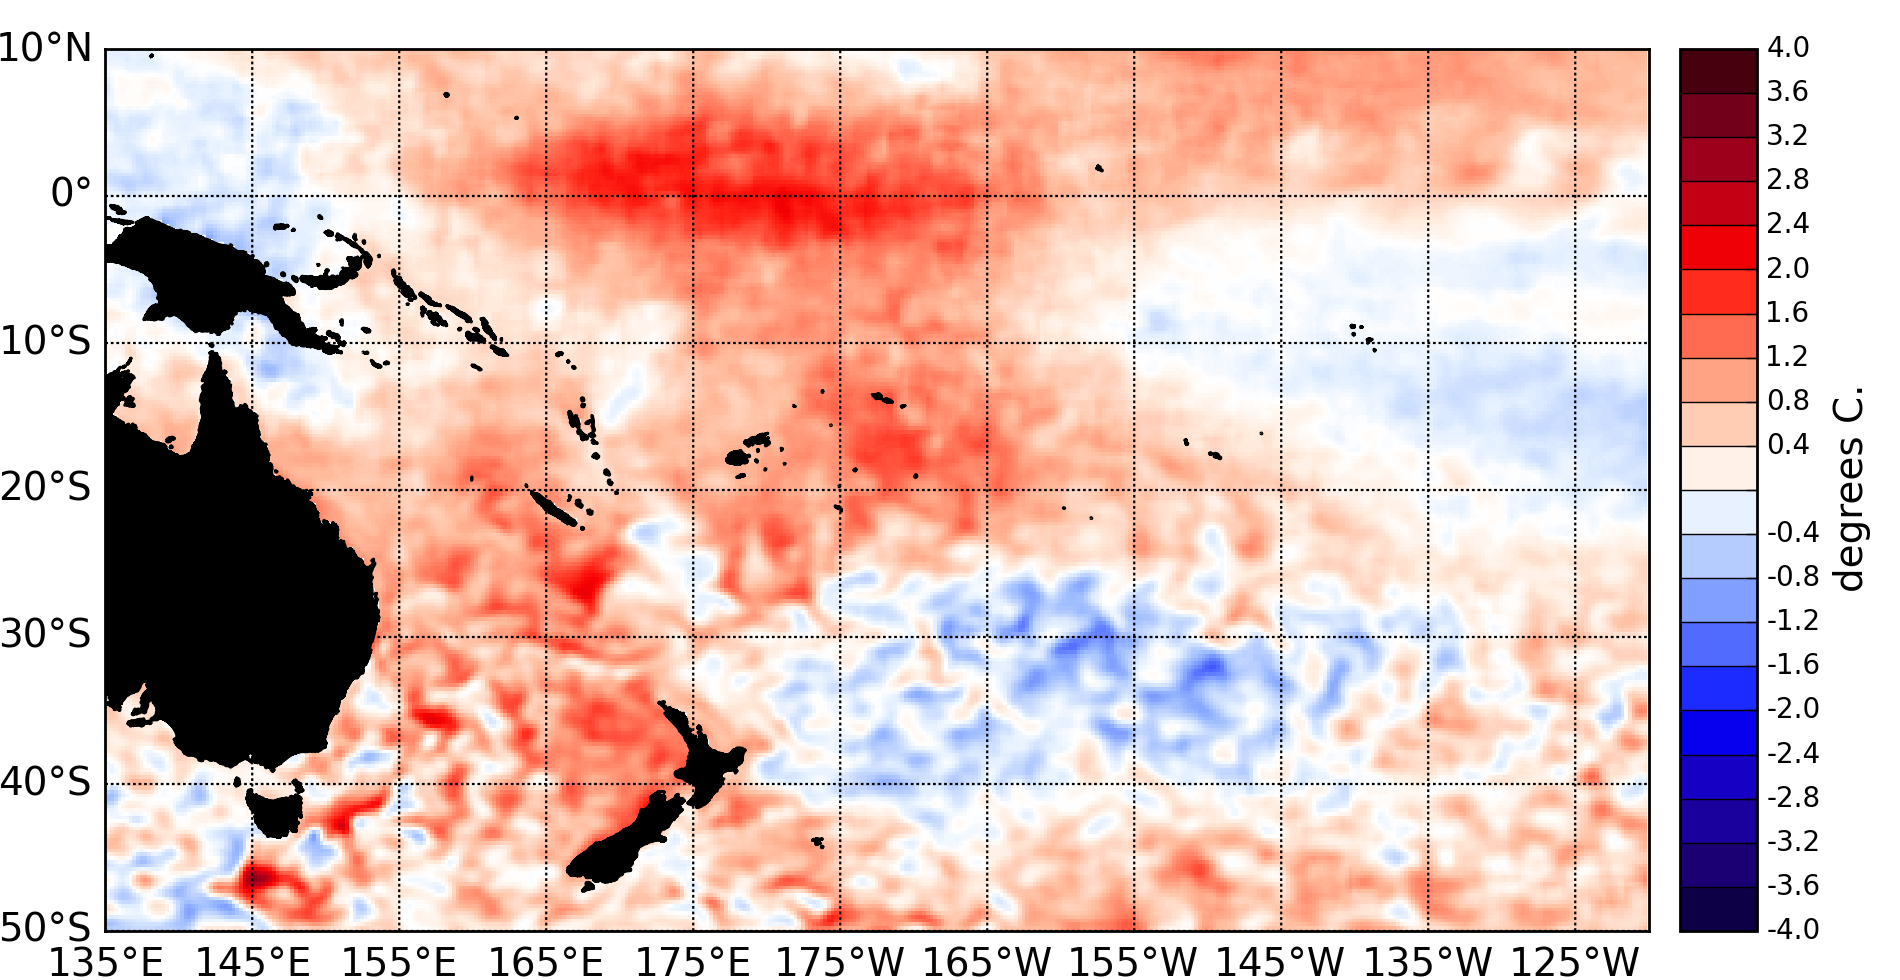
Sea surface temperature (SST) anomalies in the tropical Pacific intensified significantly around the international Dateline during March 2015 and are currently showing a pattern consistent with weak ‘central Pacific’ or ‘Modoki’ El Niño conditions.
The latest monthly anomaly values for the NINO SST indices are: +0.55°C for NINO3.4 (was +0.43°C in February), +0.26°C for NINO3 (was +0.18°C last month) and +1.05°C for NINO4 (was +0.87°C last month). Sub-surface ocean temperature anomalies in the central Pacific at about 150m depth have increased to reach up to +5°C. Positive anomalies have also propagated further eastward in the upper Ocean (~50m) off the South American coast and reach about +3°C. Positive upper ocean heat content anomalies (upper 300m of the Ocean) have intensified just east of the international Dateline and now reach above +2°C.
The Southern Oscillation Index (SOI) was negative at -1.1 in March 2015, and convection and rainfall was more intense than normal in the central Pacific. The latest value for the TRMM ENSO index for the 30 days to 30 March is +0.87 (on the El Niño side of neutral). Together these signals indicate a weak coupling between the ocean and the atmosphere.
An exceptionally strong burst in Madden-Julian Oscillation (MJO) convective activity has been observed in the western Pacific over the first half of March 2015. At the forecast horizon of 14 days, both the dynamical and statistical CPC forecasts indicate that the MJO activity will weaken in the western Pacific. The consensus ENSO forecast from the IRI/CPC places the chance of conventional El Niño threshold being crossed over the April – June 2015 period at about 60%. The likelihood increases later during the year to reach ~70% in July - September 2015