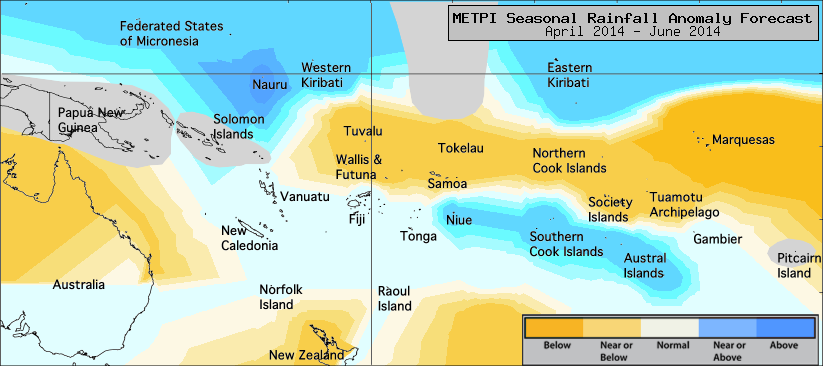
The dynamical forecast models continue to indicate drier conditions than normal for the April to June 2014 period in the central and eastern Pacific south of the Equator.
Wetter than normal conditions are expected on average along the Equator as well as from Niue southeast to the Austral Islands.
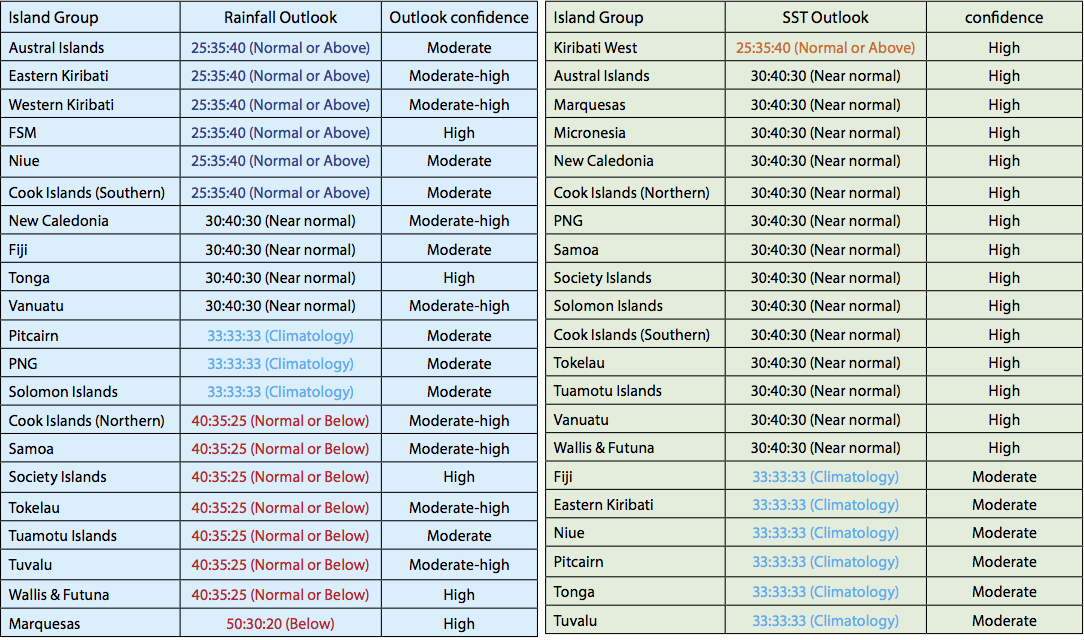
Near or above normal rainfall is forecast for the Austral Islands, Eastern Kiribati and Western Kiribati, the Federated States of Micronesia, Niue and the Southern Cook Islands.
Near normal rainfall is expected for Fiji, New Caledonia, Tonga and Vanuatu.
Normal or below normal rainfall is forecast for the Northern Cook Islands, Samoa, the Society Islands, Tokelau, the Tuamotu archipelago, Tuvalu and Wallis and Futuna.
Below normal rainfall is forecast for the Marquesas.
No clear guidance is available this month for Papua New Guinea, the Solomon Islands and Pitcairn Island.
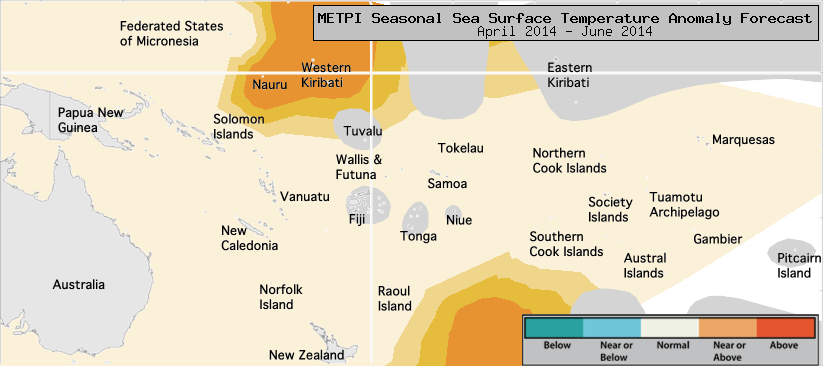
The global model ensemble forecast for SST indicates warmer than normal SSTs in the central Equatorial Pacific as well as to the east of New Zealand, where warmer than normal sea surface temperatures have persisted for more than 14 months now.
Near normal or above normal SSTs are forecast for Western Kiribati. Near normal SSTs are forecasts for the Federated States of Micronesia, Papua New Guinea, the Solomon Islands, Vanuatu, New Caledonia, Wallis and Futuna, Samoa, Tokelau, the Northern Cook Islands, the Southern Cook Islands, the Society Islands, the Tuamotu Archipelago, the Marquesas and the Austral Islands.
No clear guidance is provided for Eastern Kiribati, Tuvalu, Fiji, Tonga, Niue and Pitcairn Island.
The confidence for the rainfall outlook is generally moderate to high, uncertainty is greater for Niue, the Southern Cook Islands, Fiji and the Tuamotu archipelago. The average region–wide hit rate for rainfall forecasts issued in April is 58 %, 5 points lower than the average for all months combined. Confidence for the SST forecasts is high.
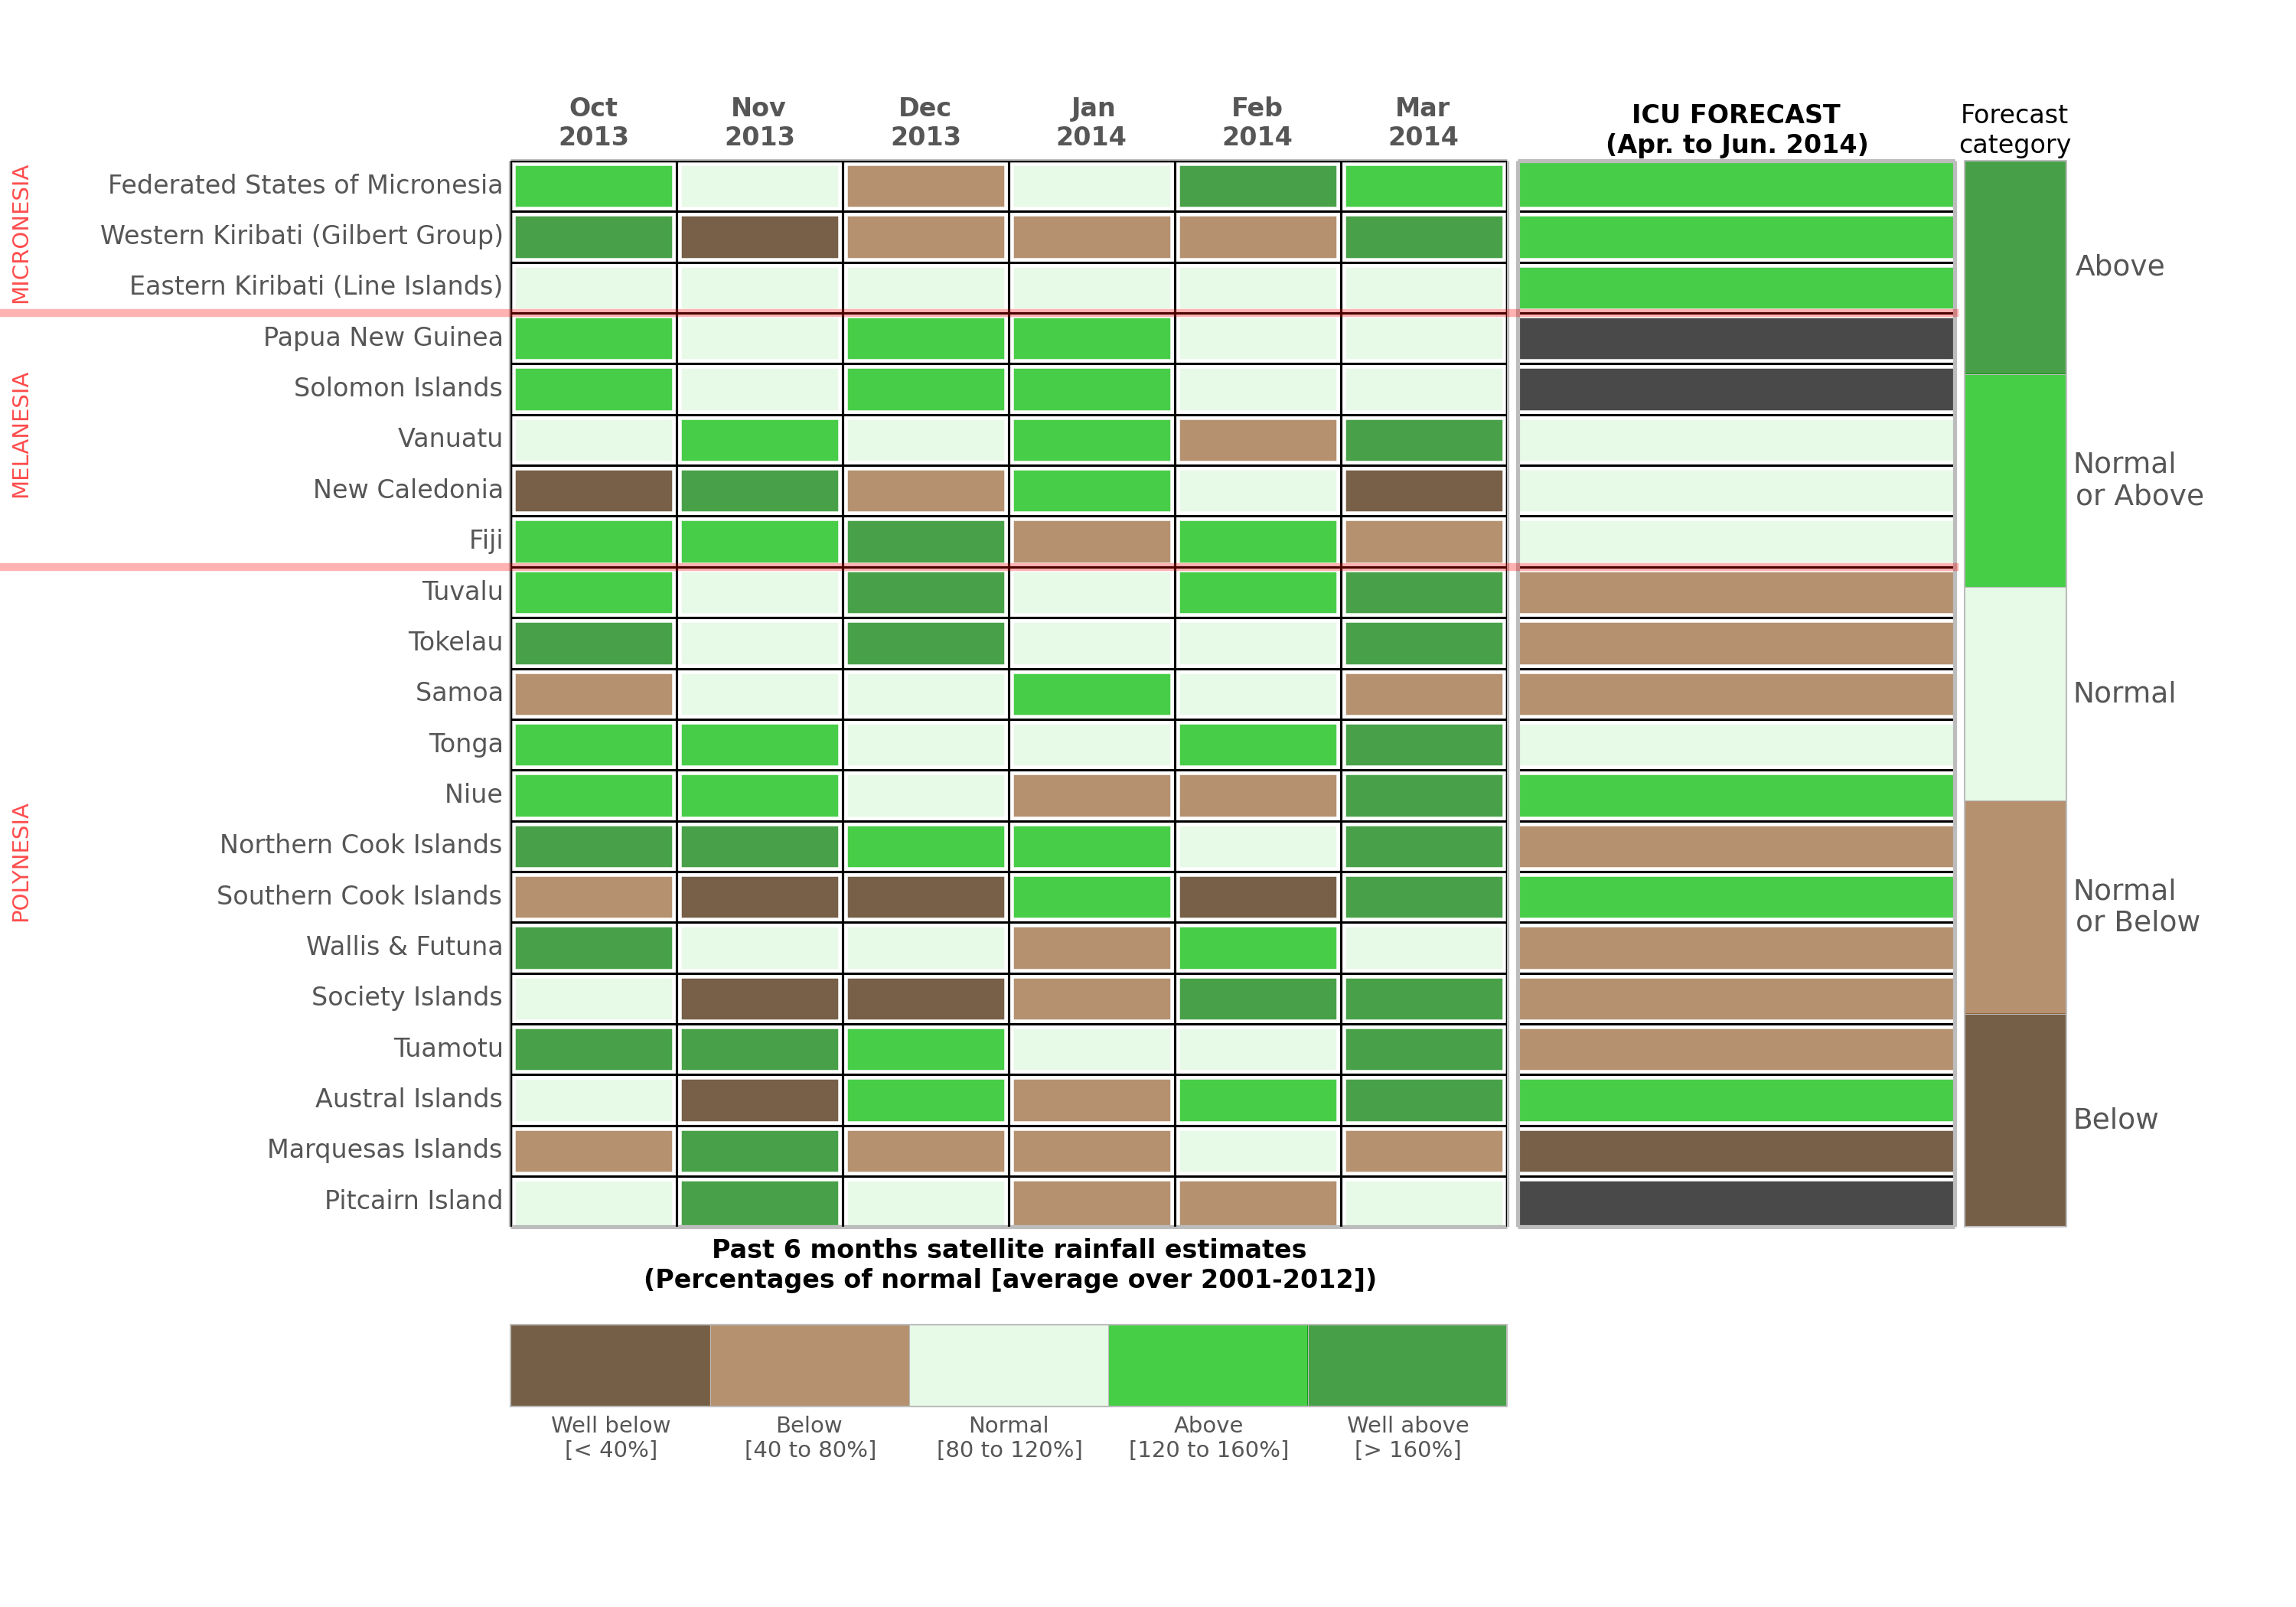
The figure on the bottom right presents the last six months rainfall anomalies for each Island group alongside the latest ICU rainfall forecast for the April-June 2014 period.
The past 6 months rainfall anomalies are based on the near-real-time TRMM (Tropical Rainfall Measurement Mission) merged satellite product available from http://trmm.gsfc.nasa.gov. The data has been downloaded and available on the link below:
ftp://disc2.nascom.nasa.gov/data/TRMM/Gridded/Derived_Products/3B42RT/Daily. →
For each Island group, the monthly value is derived from the average of all grid-points (or "pixels") in the TRMM Dataset that intersect a coastline, to ensure that the values correspond as closely as possible to rainfall on land, and excluding rainfall falling on ocean surfaces.
The climatology used has been established over the 1998 – 2012 period. The categories ("Well-below", "Below", etc) are determined according to the percentage of the normal rainfall for that month. The thresholds are indicated in the colorbar at the bottom: to give an example, "Well-below" normal rainfall means the rainfall for that month was under 40 % of the normal rainfall, "Below" normal rainfall means that between 40 and 80 % of normal rainfall was received, etc.
IMPORTANT NOTE:
Please note that, while we use the same color-scheme for the past rainfall anomalies and the ICU forecast, the type of information presented is different. In the case of the past 6 months, actual rainfall has been estimated by satellite, and the categories are well-defined by monthly estimated rainfall compared to the long-term mean. The ICU forecast, on the other hand, is probabilistic: it indicates the likelihood (percentage chance) of rainfall being at, above, or below normal for the season as a whole. When the percentage chances in two categories are close to each other, we indicate both categories: for example if the forecast is for 35 % chance of receiving below rainfall, and 40 % chance of normal rainfall, the outcome is "Normal or below".