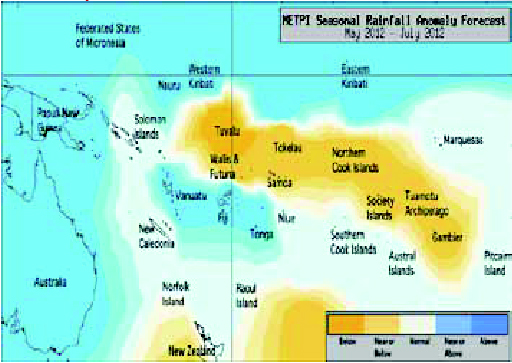
The end of the recent La Niña event is now evident in many oceanic and atmospheric indicators. The ensemble of dynamical models indicate dry conditions over and to the East of the dateline south of the Equator, while wet conditions are expected north of the Equator and along a southwest-shifted South Pacific Convergence Zone.
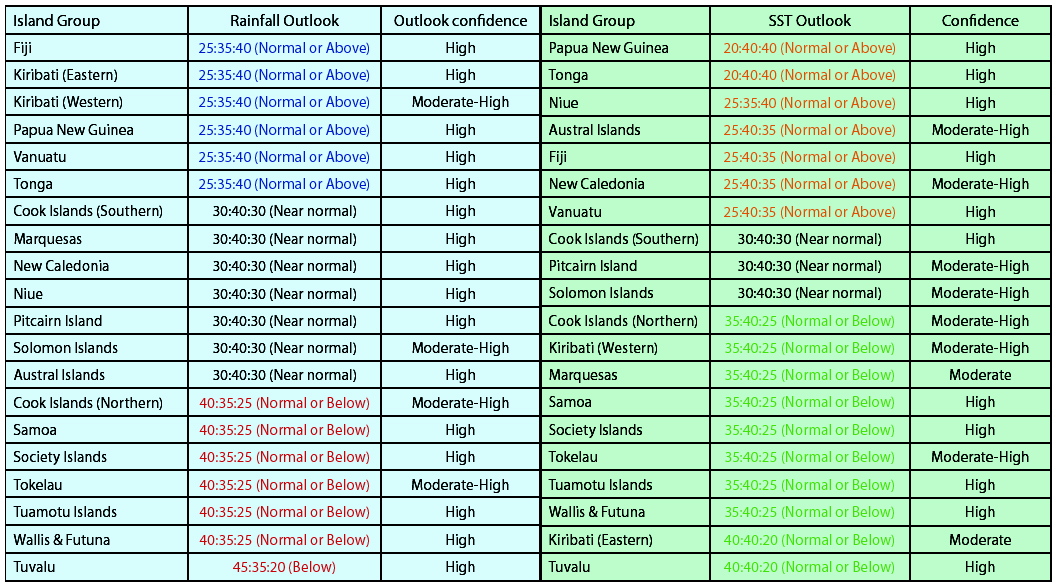
Near or above average rainfall is forecast for Fiji, Eastern Kiribati, Western Kiribati, Papua New Guinea, Vanuatu and Tonga. Near normal rainfall is expected for the Southern Cook Islands, the Marquesas, New Caledonia, Niue, Pitcairn, the Solomons and the Austral Islands.
Average or below average rainfall is forecast for the Northern Cook Islands, Samoa, the Society Islands, Tokelau, Tuamotu and Wallis & Futuna. Below normal rainfall is forecast for Tuvalu.
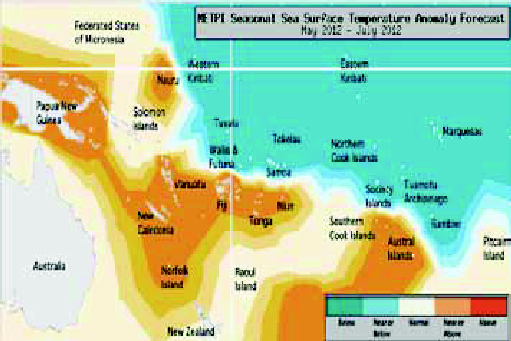
La Niña SSTa signals that have existed for past months continue to ease in the global model ensemble, and there is some indication warm anomalies could develop in the equatorial region to the east of the Dateline in the coming three months.
Normal or below normal SSTs are forecast for Eastern Kiribati, Western Kiribati, Wallis & Futuna, Tuvalu, the Tuamotu Archipelago, the Society Islands, the Northern Cook Islands, Tokealu, the Marquesas and Samoa.
Near normal or above normal sea surface temperatures are forecast for Papua New Guinea, New Caledonia, Vanuatu, Fiji, Tonga, the Austral Islands and Niue. Near normal SSTs are forecast for the Solomon Islands, the Southern Cook Islands and Pitcairn Island.
The confidence for the rainfall outlook is moderately high. The average region–wide hit rate for rainfall forecasts issued in May is 56%, seven percent lower than the long–term average for all months combined. The SST forecast confidence is moderate to high across the region, and uncertainty is greatest near the Marquesas and Eastern Kiribati.